BP 2010 Annual Report Download - page 260
Download and view the complete annual report
Please find page 260 of the 2010 BP annual report below. You can navigate through the pages in the report by either clicking on the pages listed below, or by using the keyword search tool below to find specific information within the annual report.-
 1
1 -
2
-
3
-
4
-
5
-
6
-
7
-
8
-
9
-
10
-
11
-
12
-
13
-
14
-
15
-
16
-
17
-
18
-
19
-
20
-
21
-
22
-
23
-
24
-
25
-
26
-
27
-
28
-
29
-
30
-
31
-
32
-
33
-
34
-
35
-
36
-
37
-
38
-
39
-
40
-
41
-
42
-
43
-
44
-
45
-
46
-
47
-
48
-
49
-
50
-
51
-
52
-
53
-
54
-
55
-
56
-
57
-
58
-
59
-
60
-
61
-
62
-
63
-
64
-
65
-
66
-
67
-
68
-
69
-
70
-
71
-
72
-
73
-
74
-
75
-
76
-
77
-
78
-
79
-
80
-
81
-
82
-
83
-
84
-
85
-
86
-
87
-
88
-
89
-
90
-
91
-
92
-
93
-
94
-
95
-
96
-
97
-
98
-
99
-
100
-
101
-
102
-
103
-
104
-
105
-
106
-
107
-
108
-
109
-
110
-
111
-
112
-
113
-
114
-
115
-
116
-
117
-
118
-
119
-
120
-
121
-
122
-
123
-
124
-
125
-
126
-
127
-
128
-
129
-
130
-
131
-
132
-
133
-
134
-
135
-
136
-
137
-
138
-
139
-
140
-
141
-
142
-
143
-
144
-
145
-
146
-
147
-
148
-
149
-
150
-
151
-
152
-
153
-
154
-
155
-
156
-
157
-
158
-
159
-
160
-
161
-
162
-
163
-
164
-
165
-
166
-
167
-
168
-
169
-
170
-
171
-
172
-
173
-
174
-
175
-
176
-
177
-
178
-
179
-
180
-
181
-
182
-
183
-
184
-
185
-
186
-
187
-
188
-
189
-
190
-
191
-
192
-
193
-
194
-
195
-
196
-
197
-
198
-
199
-
200
-
201
-
202
-
203
-
204
-
205
-
206
-
207
-
208
-
209
-
210
-
211
-
212
-
213
-
214
-
215
-
216
-
217
-
218
-
219
-
220
-
221
-
222
-
223
-
224
-
225
-
226
-
227
-
228
-
229
-
230
-
231
-
232
-
233
-
234
-
235
-
236
-
237
-
238
-
239
-
240
-
241
-
242
-
243
-
244
-
245
-
246
-
247
-
248
-
249
-
 250
250 -
 251
251 -
 252
252 -
 253
253 -
 254
254 -
 255
255 -
 256
256 -
 257
257 -
 258
258 -
 259
259 -
 260
260 -
 261
261 -
 262
262 -
 263
263 -
 264
264 -
 265
265 -
 266
266 -
 267
267 -
 268
268 -
 269
269 -
 270
270 -
271
-
272
 |
 |

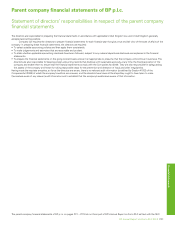
Parent company financial statements of BP p.l.c.
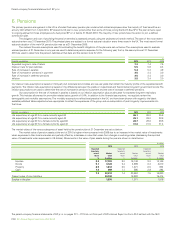
6. Pensions
The primary pension arrangement in the UK is a funded final salary pension plan under which retired employees draw the majority of their benefit as an
annuity. With effect from 1 April 2010, BP closed its UK plan to new joiners other than some of those joining the North Sea SPU. The plan remains open
to ongoing accrual for those employees who had joined BP on or before 31 March 2010. The majority of new joiners have the option to join a defined
contribution plan.
The obligation and cost of providing the pension benefits is assessed annually using the projected unit credit method. The date of the most recent
actuarial review was 31 December 2010. The principal plans are subject to a formal actuarial valuation every three years in the UK. The most recent formal
actuarial valuation of the main UK pension plan was as at 31 December 2008.
The material financial assumptions used for estimating the benefit obligations of the plans are set out below. The assumptions used to evaluate
accrued pension at 31 December in any year are used to determine pension expense for the following year, that is, the assumptions at 31 December
2010 are used to determine the pension liabilities at that date and the pension cost for 2011.
Financial assumptions 2010 2009 2008
Expected long-term rate of return 7.3 7.4 7.5
Discount rate for plan liabilities 5.5 5.8 6.3
Rate of increase in salaries 5.4 5.3 4.9
Rate of increase for pensions in payment 3.5 3.4 3.0
Rate of increase in deferred pensions 3.5 3.4 3.0
Inflation 3.5 3.4 3.0
%
Our discount rate assumption is based on third-party AA corporate bond indices and we use yields that reflect the maturity profile of the expected benefit
payments. The inflation rate assumption is based on the difference between the yields on index-linked and fixed-interest long-term government bonds. The
inflation assumptions are used to determine the rate of increase for pensions in payment and the rate of increase in deferred pensions.
Our assumption for the rate of increase in salaries is based on our inflation assumption plus an allowance for expected long-term real salary
growth. This includes allowance for promotion-related salary growth of 0.4%. In addition to the financial assumptions, we regularly review the
demographic and mortality assumptions. The mortality assumptions reflect best practice in the UK, and have been chosen with regard to the latest
available published tables adjusted where appropriate to reflect the experience of the group and an extrapolation of past longevity improvements into
the future.
Years
Mortality assumptions 2010 2009 2008
Life expectancy at age 60 for a male currently aged 60 26.1 26.0 25.9
Life expectancy at age 60 for a male currently aged 40 29.1 29.0 28.9
Life expectancy at age 60 for a female currently aged 60 28.7 28.6 28.5
Life expectancy at age 60 for a female currently aged 40 31.6 31.5 31.4
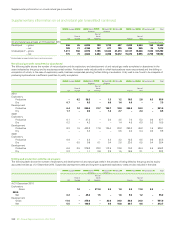
The market values of the various categories of asset held by the pension plan at 31 December are set out below.
The market value of pension assets at the end of 2010 is higher when compared with 2009 due to an increase in the market value of investments
when expressed in their local currencies and partially offset by a decrease in value that arises from changes in exchange rates (decreasing the reported
value of investments when expressed in US dollars). Movements in the value of plan assets during the year are shown in detail below.
$ million
2010 2009 2008
Expected Expected Expected
long-term long-term long-term
rate of Market rate of Market rate of Market
return value return value return value
% $ million % $ million % $ million
Equities 8.0 17,703 8.0 16,148 8.0 13,106
Bonds 5.1 3,128 5.4 2,989 6.3 2,610
Property 6.5 1,412 6.5 1,221 6.5 932
Cash 1.4 369 1.1 595 2.9 282
7.3 22,612 7.4 20,953 7.5 16,930
Present value of plan liabilities 20,742 19,882 15,414
Surplus in the plan 1,870 1,071 1,516
The parent company financial statements of BP p.l.c. on pages PC1 – PC16 do not form part of BP’s Annual Report on Form 20-F as filed with the SEC.
PC8 BP Annual Report and Form 20-F 2010