BP 2010 Annual Report Download - page 266
Download and view the complete annual report
Please find page 266 of the 2010 BP annual report below. You can navigate through the pages in the report by either clicking on the pages listed below, or by using the keyword search tool below to find specific information within the annual report.-
 1
1 -
2
-
3
-
4
-
5
-
6
-
7
-
8
-
9
-
10
-
11
-
12
-
13
-
14
-
15
-
16
-
17
-
18
-
19
-
20
-
21
-
22
-
23
-
24
-
25
-
26
-
27
-
28
-
29
-
30
-
31
-
32
-
33
-
34
-
35
-
36
-
37
-
38
-
39
-
40
-
41
-
42
-
43
-
44
-
45
-
46
-
47
-
48
-
49
-
50
-
51
-
52
-
53
-
54
-
55
-
56
-
57
-
58
-
59
-
60
-
61
-
62
-
63
-
64
-
65
-
66
-
67
-
68
-
69
-
70
-
71
-
72
-
73
-
74
-
75
-
76
-
77
-
78
-
79
-
80
-
81
-
82
-
83
-
84
-
85
-
86
-
87
-
88
-
89
-
90
-
91
-
92
-
93
-
94
-
95
-
96
-
97
-
98
-
99
-
100
-
101
-
102
-
103
-
104
-
105
-
106
-
107
-
108
-
109
-
110
-
111
-
112
-
113
-
114
-
115
-
116
-
117
-
118
-
119
-
120
-
121
-
122
-
123
-
124
-
125
-
126
-
127
-
128
-
129
-
130
-
131
-
132
-
133
-
134
-
135
-
136
-
137
-
138
-
139
-
140
-
141
-
142
-
143
-
144
-
145
-
146
-
147
-
148
-
149
-
150
-
151
-
152
-
153
-
154
-
155
-
156
-
157
-
158
-
159
-
160
-
161
-
162
-
163
-
164
-
165
-
166
-
167
-
168
-
169
-
170
-
171
-
172
-
173
-
174
-
175
-
176
-
177
-
178
-
179
-
180
-
181
-
182
-
183
-
184
-
185
-
186
-
187
-
188
-
189
-
190
-
191
-
192
-
193
-
194
-
195
-
196
-
197
-
198
-
199
-
200
-
201
-
202
-
203
-
204
-
205
-
206
-
207
-
208
-
209
-
210
-
211
-
212
-
213
-
214
-
215
-
216
-
217
-
218
-
219
-
220
-
221
-
222
-
223
-
224
-
225
-
226
-
227
-
228
-
229
-
230
-
231
-
232
-
233
-
234
-
235
-
236
-
237
-
238
-
239
-
240
-
241
-
242
-
243
-
244
-
245
-
246
-
247
-
248
-
249
-
250
-
251
-
252
-
253
-
254
-
255
-
 256
256 -
 257
257 -
 258
258 -
 259
259 -
 260
260 -
 261
261 -
 262
262 -
 263
263 -
 264
264 -
 265
265 -
 266
266 -
 267
267 -
 268
268 -
 269
269 -
 270
270 -
 271
271 -
 272
272
 |
 |

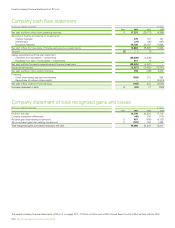
ParentcompanynancialstatementsofBPp.l.c.
11.Share-basedpaymentscontinued
BPShareMatchPlans
ThesearematchingshareplansunderwhichBPmatchesemployees’owncontributionsofsharesuptoapredeterminedlimit.TheplansarerunintheUK
andinmorethan60othercountries.TheUKplanisrunonamonthlybasiswithsharesbeingheldintrustforveyearsbeforetheycanbereleasedfreeof
anyincometaxandnationalinsuranceliability.Inothercountriestheplanisrunonanannualbasiswithsharesbeingheldintrustforthreeyears.Theplan
isoperatedonacashbasisinthosecountrieswherethereareregulatoryrestrictionspreventingtheholdingofBPshares.WhentheemployeeleavesBP
allsharesmustberemovedfromtrustandunitsundertheplanoperatedonacashbasismustbeencashed.
Localplans
InsomecountriesBPprovideslocalschemebenets,therulesandqualicationsforwhichvaryaccordingtolocalcircumstances.
Employee Share Ownership Plans (ESOPs)
ESOPshavebeenestablishedtoacquireBPsharestosatisfyanyawardsmadetoparticipantsundertheBPshareplansasrequired.TheESOPshavewaived
theirrightstodividendsonsharesheldforfutureawardsandarefundedbythegroup.Untilsuchtimeasthecompany’sownsharesheldbytheESOPtrusts
vestunconditionallytoemployees,theamountpaidforthosesharesisdeductedinarrivingatshareholders’equity(seeNote8).Assetsandliabilitiesofthe
ESOPsarerecognizedasassetsandliabilitiesofthegroup.
At31December2010theESOPsheld11,477,253shares(200918,062,246sharesand200829,051,082shares)forpotentialfutureawards,which
hadamarketvalueof$82million(2009$174millionand2008$220million).
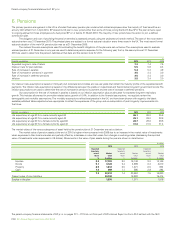
Share option transactions
Detailsofshareoptiontransactionsfortheyearundertheshareoptionplansareasfollows:
2010 2009 2008
Weighted Weighted Weighted
Number average Number average Number average
of exercise price of exerciseprice of exerciseprice
options $ options $ options $
Outstandingat1January 295,895,357 8.73 326,254,599 8.70 358,094,243 8.51
Granted 10,420,287 6.08 9,679,836 6.55 8,062,899 8.96
Forfeited (9,499,661) 7.88 (5,954,325) 8.81 (2,502,784) 8.50
Exercised (31,839,034) 7.97 (21,293,871) 7.53 (37,277,895) 6.97
Expired (1,670,227) 8.71 (12,790,882) 8.01 (121,864) 7.00
Outstandingat31December 263,306,722 8.75 295,895,357 8.73 326,254,599 8.70
Exercisableat31December 242,530,635 8.90 274,685,068 8.80 260,178,938 8.22
Theweightedaveragesharepriceatthedateofexercisewas$9.54(2009$9.10and2008$10.87).Fortheoptionsoutstandingat31December2010,the
exercisepricerangesandweightedaverageremainingcontractuallivesareshownbelow.
Options outstanding Options exercisable
Weighted Weighted Weighted
Number average average Number average
of remaining life exercise price of exercise price
Rangeofexerciseprices shares years $ shares $
$6.09–$7.53 54,821,144 2.68 6.36 39,231,453 6.40
$7.54–$8.99 115,187,261 1.71 8.19 112,551,834 8.17
$9.00–$10.45 21,827,393 3.54 9.88 19,276,424 9.98
$10.46–$11.92 71,470,924 4.81 11.14 71,470,924 11.14
263,306,722 2.90 8.75 242,530,635 8.90
Fair values and associated details for options and shares granted
2010 2009 2008
ShareSave ShareSave ShareSave ShareSave ShareSave ShareSave
3 year 5 year 3year 5year 3year 5year
Optionpricingmodelused Binomial Binomial Binomial Binomial Binomial Binomial
Weightedaveragefairvalue $0.06 $0.08 $1.07 $1.07 $1.82 $1.74
Weightedaverageshareprice $4.58 $4.58 $7.87 $7.87 $11.26 $11.26
Weightedaverageexerciseprice $5.90 $5.90 $6.92 $6.92 $9.70 $9.70
Expectedvolatility 22% 23% 32% 32% 23% 23%
Optionlife 3.5 years5.5 years 3.5years 5.5years 3.5years 5.5years
Expecteddividends 8.40% 8.40% 7.40% 7.40% 4.60% 4.60%
Riskfreeinterestrate 1.25% 2.00% 3.00% 3.75% 5.00% 5.00%
Expectedexercisebehaviour 100% year 4 100% year 6 100%year4 100%year6 100%year4 100%year6
TheparentcompanynancialstatementsofBPp.l.c.onpagesPC1–PC16donotformpartofBP’sAnnualReportonForm20-FasledwiththeSEC.
PC14BPAnnualReportandForm20-F2010