BP 2010 Annual Report Download - page 233
Download and view the complete annual report
Please find page 233 of the 2010 BP annual report below. You can navigate through the pages in the report by either clicking on the pages listed below, or by using the keyword search tool below to find specific information within the annual report.-
 1
1 -
2
-
3
-
4
-
5
-
6
-
7
-
8
-
9
-
10
-
11
-
12
-
13
-
14
-
15
-
16
-
17
-
18
-
19
-
20
-
21
-
22
-
23
-
24
-
25
-
26
-
27
-
28
-
29
-
30
-
31
-
32
-
33
-
34
-
35
-
36
-
37
-
38
-
39
-
40
-
41
-
42
-
43
-
44
-
45
-
46
-
47
-
48
-
49
-
50
-
51
-
52
-
53
-
54
-
55
-
56
-
57
-
58
-
59
-
60
-
61
-
62
-
63
-
64
-
65
-
66
-
67
-
68
-
69
-
70
-
71
-
72
-
73
-
74
-
75
-
76
-
77
-
78
-
79
-
80
-
81
-
82
-
83
-
84
-
85
-
86
-
87
-
88
-
89
-
90
-
91
-
92
-
93
-
94
-
95
-
96
-
97
-
98
-
99
-
100
-
101
-
102
-
103
-
104
-
105
-
106
-
107
-
108
-
109
-
110
-
111
-
112
-
113
-
114
-
115
-
116
-
117
-
118
-
119
-
120
-
121
-
122
-
123
-
124
-
125
-
126
-
127
-
128
-
129
-
130
-
131
-
132
-
133
-
134
-
135
-
136
-
137
-
138
-
139
-
140
-
141
-
142
-
143
-
144
-
145
-
146
-
147
-
148
-
149
-
150
-
151
-
152
-
153
-
154
-
155
-
156
-
157
-
158
-
159
-
160
-
161
-
162
-
163
-
164
-
165
-
166
-
167
-
168
-
169
-
170
-
171
-
172
-
173
-
174
-
175
-
176
-
177
-
178
-
179
-
180
-
181
-
182
-
183
-
184
-
185
-
186
-
187
-
188
-
189
-
190
-
191
-
192
-
193
-
194
-
195
-
196
-
197
-
198
-
199
-
200
-
201
-
202
-
203
-
204
-
205
-
206
-
207
-
208
-
209
-
210
-
211
-
212
-
213
-
214
-
215
-
216
-
217
-
218
-
219
-
220
-
221
-
222
-
 223
223 -
 224
224 -
 225
225 -
 226
226 -
 227
227 -
 228
228 -
 229
229 -
 230
230 -
 231
231 -
 232
232 -
 233
233 -
 234
234 -
 235
235 -
 236
236 -
 237
237 -
 238
238 -
 239
239 -
 240
240 -
 241
241 -
 242
242 -
 243
243 -
244
-
245
-
246
-
247
-
248
-
249
-
250
-
251
-
252
-
253
-
254
-
255
-
256
-
257
-
258
-
259
-
260
-
261
-
262
-
263
-
264
-
265
-
266
-
267
-
268
-
269
-
270
-
271
-
272
 |
 |

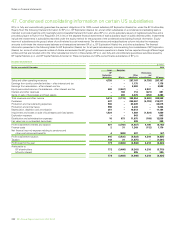
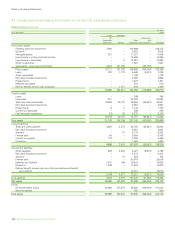
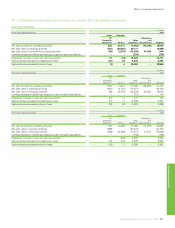
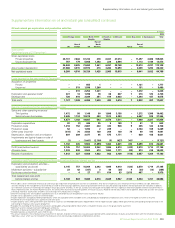
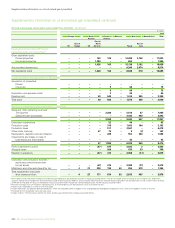
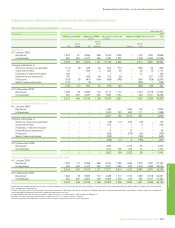
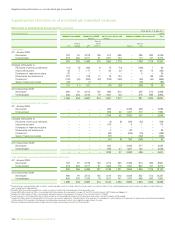
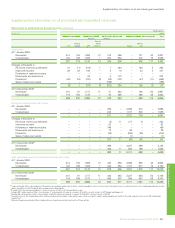
Supplementaryinformationonoilandnaturalgas(unaudited)
Financial statements
Supplementaryinformationonoilandnaturalgas(unaudited)continued
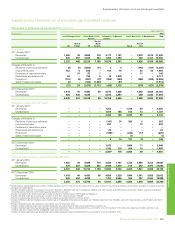
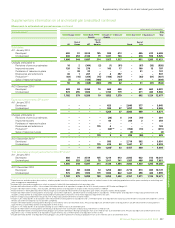
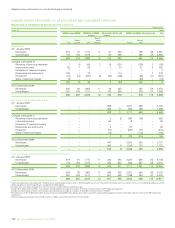
Oil and natural gas exploration and production activities continued
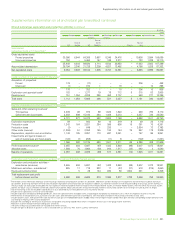
$million
2009
Europe North South Africa Asia Australasia Total
America America
Restof
Restof North Restof
UK Europe US America Russia Asia
Subsidiariesa
Capitalizedcostsat31Decemberb
Grosscapitalizedcosts
Provedproperties 35,096 6,644 64,366 3,967 8,346 24,476 _ 10,900 2,894 156,689
Unprovedproperties 752 – 5,464 147 198 2,377 – 733 1,039 10,710
35,848 6,644 69,830 4,114 8,544 26,853 – 11,633 3,933 167,399
Accumulateddepreciation 26,794 3,306 31,728 2,309 4,837 12,492 – 4,798 1,038 87,302
Netcapitalizedcosts 9,054 3,338 38,102 1,805 3,707 14,361 – 6,835 2,895 80,097
Costsincurredfortheyearended31Decemberb
Acquisitionofpropertiesc
Proved 179 – (17) – – – – 306 – 468
Unproved (1) – 370 1 – 18 – – 10 398
178 – 353 1 – 18 – 306 10 866
Explorationandappraisalcostsd 183 – 1,377 79 78 712 8 315 53 2,805
Development 751 1,054 4,208 386 453 2,707 – 560 277 10,396
Totalcosts 1,112 1,054 5,938 466 531 3,437 8 1,181 340 14,067
Resultsofoperationsfortheyearended31December
Salesandotheroperatingrevenuese
Thirdparties 2,239 68 972 99 1,525 1,846 – 636 785 8,170
Salesbetweenbusinesses 2,482 809 15,100 484 1,409 5,313 – 6,257 726 32,580
4,721 877 16,072 583 2,934 7,159 – 6,893 1,511 40,750
Explorationexpenditure 59 – 663 80 16 219 8 49 22 1,116
Productioncosts 1,243 164 2,821 284 395 908 15 361 70 6,261
Productiontaxes (3) – 649 1 220 – – 2,854 72 3,793
Othercosts(income)f (1,259) 51 2,353 145 184 144 76 967 178 2,839
Depreciation,depletionandamortization 1,148 185 3,857 170 697 2,041 – 757 96 8,951
Impairmentsand(gains)losseson
saleofbusinessesandxedassets (122) (7) (208) – (11) (1) – (702)j – (1,051)
1,066 393 10,135 680 1,501 3,311 99 4,286 438 21,909
Prot(loss)beforetaxationg 3,655 484 5,937 (97) 1,433 3,848 (99) 2,607 1,073 18,841
Allocabletaxes 1,568 76 1,902 (58) 916 1,517 (25) 682 2 6,580
Resultsofoperations 2,087 408 4,035 (39) 517 2,331 (74) 1,925 1,071 12,261
ExplorationandProductionsegmentreplacementcostprotbeforeinterestandtax
Explorationandproductionactivities–
subsidiaries(asabove) 3,655 484 5,937 (97) 1,433 3,848 (99) 2,607 1,073 18,841
Midstreamactivities–subsidiarieshj 925 17 719 833 17 (27) (37) 518 (315) 2,650
Equity-accountedentitiesi – 5 29 134 630 56 1,924 531 – 3,309
Totalreplacementcostprot
beforeinterestandtax 4,580 506 6,685 870 2,080 3,877 1,788 3,656 758 24,800
aT
hesetablescontaininformationrelatingtooilandnaturalgasexplorationandproductionactivitiesofsubsidiaries.Midstreamactivitiesrelatingtothemanagementandownershipofcrudeoilandnatural
gaspipelines,processingandexportterminalsandLNGprocessingfacilitiesandtransportationareexcluded.Inaddition,ourmidstreamactivitiesofmarketingandtradingofnaturalgas,powerandNGLsin
theUS,Canada,UKandEuropeareexcluded.ThemostsignicantmidstreampipelineinterestsincludetheTrans-AlaskaPipelineSystem,theFortiesPipelineSystem,theCentralAreaTransmissionSystem
pipeline,theSouthCaucasusPipelineandtheBaku-Tbilisi-Ceyhanpipeline.MajorLNGactivitiesarelocatedinTrinidad,IndonesiaandAustraliaandBPisalsoinvestingintheLNGbusinessinAngola.
b
Decommissioningassetsareincludedincapitalizedcostsat31Decemberbutareexcludedfromcostsincurredfortheyear.
c
Includescostscapitalizedasaresultofassetexchanges.
d
Includesexplorationandappraisaldrillingexpenditures,whicharecapitalizedwithinintangibleassets,andgeologicalandgeophysicalexplorationcosts,whicharechargedtoincomeasincurred.
e
Presentednetoftransportationcosts,purchasesandsalestaxes.SalesbetweenbusinessesandthirdpartysaleshavebeenamendedintheUSwithoutneteffecttototalsales.
fIncludespropertytaxes,othergovernmenttakeandthefairvaluegainonembeddedderivativesof$663million.TheUKregionincludesa$783milliongainoffsetbycorrespondingchargesprimarilyinthe
US,relatingtothegroupself-insuranceprogramme.
gEx
cludestheunwindingofthediscountonprovisionsandpayablesamountingto$308millionwhichisincludedinnancecostsinthegroupincomestatement.
hMidstreamactivitiesexcludeinventoryholdinggainsandlosses.
iTheprotsofequity-accountedentitiesareincludedafterinterestandtax.
jIncludesthegainondisposalofupstreamassetsassociatedwithoursaleofour46%stakeinLukArco(seeNote5).
BPAnnualReportandForm20-F2010 231