BP 2010 Annual Report Download - page 245
Download and view the complete annual report
Please find page 245 of the 2010 BP annual report below. You can navigate through the pages in the report by either clicking on the pages listed below, or by using the keyword search tool below to find specific information within the annual report.-
 1
1 -
2
-
3
-
4
-
5
-
6
-
7
-
8
-
9
-
10
-
11
-
12
-
13
-
14
-
15
-
16
-
17
-
18
-
19
-
20
-
21
-
22
-
23
-
24
-
25
-
26
-
27
-
28
-
29
-
30
-
31
-
32
-
33
-
34
-
35
-
36
-
37
-
38
-
39
-
40
-
41
-
42
-
43
-
44
-
45
-
46
-
47
-
48
-
49
-
50
-
51
-
52
-
53
-
54
-
55
-
56
-
57
-
58
-
59
-
60
-
61
-
62
-
63
-
64
-
65
-
66
-
67
-
68
-
69
-
70
-
71
-
72
-
73
-
74
-
75
-
76
-
77
-
78
-
79
-
80
-
81
-
82
-
83
-
84
-
85
-
86
-
87
-
88
-
89
-
90
-
91
-
92
-
93
-
94
-
95
-
96
-
97
-
98
-
99
-
100
-
101
-
102
-
103
-
104
-
105
-
106
-
107
-
108
-
109
-
110
-
111
-
112
-
113
-
114
-
115
-
116
-
117
-
118
-
119
-
120
-
121
-
122
-
123
-
124
-
125
-
126
-
127
-
128
-
129
-
130
-
131
-
132
-
133
-
134
-
135
-
136
-
137
-
138
-
139
-
140
-
141
-
142
-
143
-
144
-
145
-
146
-
147
-
148
-
149
-
150
-
151
-
152
-
153
-
154
-
155
-
156
-
157
-
158
-
159
-
160
-
161
-
162
-
163
-
164
-
165
-
166
-
167
-
168
-
169
-
170
-
171
-
172
-
173
-
174
-
175
-
176
-
177
-
178
-
179
-
180
-
181
-
182
-
183
-
184
-
185
-
186
-
187
-
188
-
189
-
190
-
191
-
192
-
193
-
194
-
195
-
196
-
197
-
198
-
199
-
200
-
201
-
202
-
203
-
204
-
205
-
206
-
207
-
208
-
209
-
210
-
211
-
212
-
213
-
214
-
215
-
216
-
217
-
218
-
219
-
220
-
221
-
222
-
223
-
224
-
225
-
226
-
227
-
228
-
229
-
230
-
231
-
232
-
233
-
234
-
 235
235 -
 236
236 -
 237
237 -
 238
238 -
 239
239 -
 240
240 -
 241
241 -
 242
242 -
 243
243 -
 244
244 -
 245
245 -
 246
246 -
 247
247 -
 248
248 -
 249
249 -
 250
250 -
 251
251 -
 252
252 -
 253
253 -
 254
254 -
 255
255 -
256
-
257
-
258
-
259
-
260
-
261
-
262
-
263
-
264
-
265
-
266
-
267
-
268
-
269
-
270
-
271
-
272
 |
 |

Financial statements
b
d
e
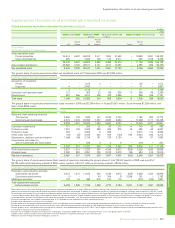
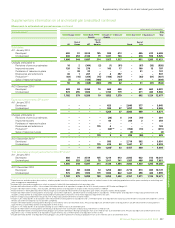
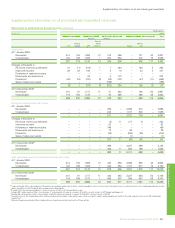
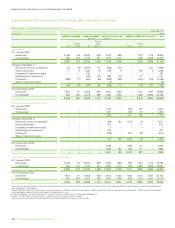
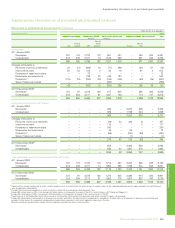
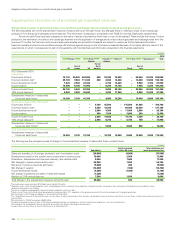
Supplementaryinformationonoilandnaturalgas(unaudited)
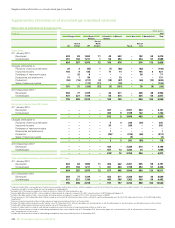
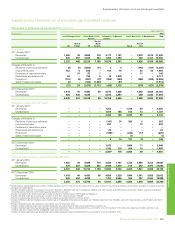
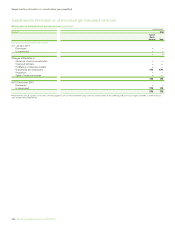
Supplementaryinformationonoilandnaturalgas(unaudited)continued
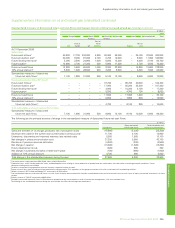
Movements in estimated net proved reserves continued
millionbarrelsofoilequivalent
Total hydrocarbonsa 2008
Europe North South Africa Asia Australasia Total
America America
Restof
Restof North Restof
UK Europe USe America Russia Asia
Subsidiaries
At1January2008
Developed 767 116 3,722 118 631 427 – 340 240 6,361
Undeveloped 219 239 2,077 74 1,576 593 – 591 853 6,222
986 355 5,799 192 2,207 1,020 – 931 1,093 12,583
Changesattributableto
Revisionsofpreviousestimates 20 (12) (569) 10 (71) 289 – 194 67 (72)
Improvedrecovery 52 30 410 3 36 18 – 61 4 614
Purchasesofreserves-in-place – – 32 – – – – – – 32
Discoveriesandextensions – – 158 22 168 187 – 7 – 542
Productionbf (115) (18) (334) (20) (186) (135) – (94) (35) (937)
Salesofreserves-in-place – – – – (200) – – – – (200)
(43) – (303) 15 (253) 359 – 168 36 (21)
At31December2008c
Developed 724 91 3,279 126 617 645 – 385 382 6,249
Undeveloped 219 264 2,217 81 1,337 734 – 714 747 6,313
943 355 5,496 207 1,954 1,379 – 1,099 1,129 12,562
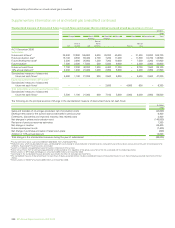
Equity-accountedentities(BPshare)g
At1January2008
Developed – – – – 583 – 2,233 606 – 3,422
Undeveloped – – – – 386 – 1,199 224 – 1,809
– – – – 969 – 3,432 830 – 5,231
Changesattributableto
Revisionsofpreviousestimates – – – – (20) 42 436 (1) – 457
Improvedrecovery – – – – 115 – – 2 – 117
Purchasesofreserves-in-place – – – – 200 – – – – 200
Discoveriesandextensions – – – – 46 – 26 – – 72
Productionbf – – – – (66) – (341) (84) – (491)
Salesofreserves-in-place – – – – – – (1) – – (1)
– – – – 275 42 120 (83) – 354
At31December2008d
Developed – – – – 658 – 2,495 529 – 3,682
Undeveloped – – – – 586 42 1,057 218 – 1,903
– – – – 1,244 42 3,552 747 – 5,585
Totalsubsidiariesandequity-accountedentities(BPshare)
At1January2008
Developed 767 116 3,722 118 1,214 427 2,233 946 240 9,783
Undeveloped 219 239 2,077 74 1,962 593 1,199 815 853 8,031
986 355 5,799 192 3,176 1,020 3,432 1,761 1,093 17,814
At31December2008
Developed 724 91 3,279 126 1,275 645 2,495 914 382 9,931
Undeveloped 219 264 2,217 81 1,923 776 1,057 932 747 8,216
943 355 5,496 207 3,198 1,421 3,552 1,846 1,129 18,147
a
Provedreservesexcluderoyaltiesduetoothers,whetherpayableincashorinkind,wheretheroyaltyownerhasadirectinterestintheunderlyingproductionandtheoptionandabilitytomakeliftingand
salesarrangementsindependently.
E
xcludesNGLsfromprocessingplantsinwhichaninterestisheldof29thousandbarrelsofoilequivalentaday.
c
Includes807millionbarrelsofNGLs.Alsoincludes557millionbarrelsofoilequivalentinrespectofthe30%minorityinterestinBPTrinidadandTobagoLLC.
Includes36millionbarrelsofNGLs.Alsoincludes239millionbarrelsofoilequivalentinrespectoftheminorityinterestinTNK-BP.
ProvedreservesinthePrudhoeBayeldinAlaskaincludeanestimated54millionbarrelsofoilequivalentuponwhichanetprotsroyaltywillbepayable.
f
Includes33millionbarrelsofoilequivalentofnaturalgasconsumedinoperations,25millionbarrelsofoilequivalentinsubsidiaries,8millionbarrelsofoilequivalentinequity-accountedentitiesand
excludes3millionbarrelsofoilequivalentofproducednon-hydrocarboncomponentswhichmeetregulatoryrequirementsforsales.
g
Volumesofequity-accountedentitiesincludevolumesofequity-accountedinvestmentsofthoseentities.
BPAnnualReportandForm20-F2010 243