BP 2010 Annual Report Download - page 261
Download and view the complete annual report
Please find page 261 of the 2010 BP annual report below. You can navigate through the pages in the report by either clicking on the pages listed below, or by using the keyword search tool below to find specific information within the annual report.-
 1
1 -
2
-
3
-
4
-
5
-
6
-
7
-
8
-
9
-
10
-
11
-
12
-
13
-
14
-
15
-
16
-
17
-
18
-
19
-
20
-
21
-
22
-
23
-
24
-
25
-
26
-
27
-
28
-
29
-
30
-
31
-
32
-
33
-
34
-
35
-
36
-
37
-
38
-
39
-
40
-
41
-
42
-
43
-
44
-
45
-
46
-
47
-
48
-
49
-
50
-
51
-
52
-
53
-
54
-
55
-
56
-
57
-
58
-
59
-
60
-
61
-
62
-
63
-
64
-
65
-
66
-
67
-
68
-
69
-
70
-
71
-
72
-
73
-
74
-
75
-
76
-
77
-
78
-
79
-
80
-
81
-
82
-
83
-
84
-
85
-
86
-
87
-
88
-
89
-
90
-
91
-
92
-
93
-
94
-
95
-
96
-
97
-
98
-
99
-
100
-
101
-
102
-
103
-
104
-
105
-
106
-
107
-
108
-
109
-
110
-
111
-
112
-
113
-
114
-
115
-
116
-
117
-
118
-
119
-
120
-
121
-
122
-
123
-
124
-
125
-
126
-
127
-
128
-
129
-
130
-
131
-
132
-
133
-
134
-
135
-
136
-
137
-
138
-
139
-
140
-
141
-
142
-
143
-
144
-
145
-
146
-
147
-
148
-
149
-
150
-
151
-
152
-
153
-
154
-
155
-
156
-
157
-
158
-
159
-
160
-
161
-
162
-
163
-
164
-
165
-
166
-
167
-
168
-
169
-
170
-
171
-
172
-
173
-
174
-
175
-
176
-
177
-
178
-
179
-
180
-
181
-
182
-
183
-
184
-
185
-
186
-
187
-
188
-
189
-
190
-
191
-
192
-
193
-
194
-
195
-
196
-
197
-
198
-
199
-
200
-
201
-
202
-
203
-
204
-
205
-
206
-
207
-
208
-
209
-
210
-
211
-
212
-
213
-
214
-
215
-
216
-
217
-
218
-
219
-
220
-
221
-
222
-
223
-
224
-
225
-
226
-
227
-
228
-
229
-
230
-
231
-
232
-
233
-
234
-
235
-
236
-
237
-
238
-
239
-
240
-
241
-
242
-
243
-
244
-
245
-
246
-
247
-
248
-
249
-
250
-
 251
251 -
 252
252 -
 253
253 -
 254
254 -
 255
255 -
 256
256 -
 257
257 -
 258
258 -
 259
259 -
 260
260 -
 261
261 -
 262
262 -
 263
263 -
 264
264 -
 265
265 -
 266
266 -
 267
267 -
 268
268 -
 269
269 -
 270
270 -
 271
271 -
272
 |
 |

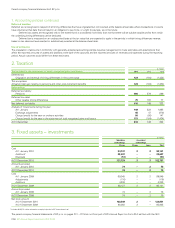
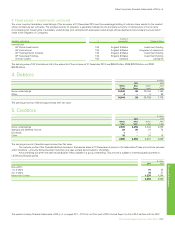
Parent company financial statements of BP p.l.c.
Financial statements
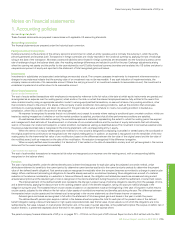
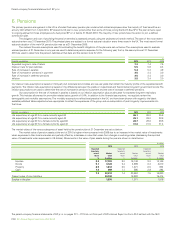
6. Pensions continued
$ million
2010 2009 2008
Analysis of the amount charged to operating profit
Current service costa 381 300 434
Past service cost – – 7
Settlement, curtailment and special termination benefits 21 34 29
Total operating charge 402 334 470
Analysis of the amount credited (charged) to other finance income
Expected return on pension plan assets 1,486 1,339 1,969
Interest on pension plan liabilities (1,098) (1,029) (1,146)
Other finance income 388 310 823
Analysis of the amount recognized in the statement of total recognized gains and losses
Actual return less expected return on pension plan assets 1,479 1,634 (6,533)
Change in assumptions underlying the present value of the plan liabilities (1,034) (2,073) 1,476
Experience gains (losses) arising on the plan liabilities 12 (146) (65)
Actuarial (loss) gain recognized in statement of total recognized gains
and losses 457 (585) (5,122)
2010 2009
Movements in benefit obligation during the year
Benefit obligation at 1 January 19,882 15,414
Exchange adjustment (775) 1,756
Current service costa 381 300
Interest cost 1,098 1,029
Special termination benefitsb 21 34
Contributions by plan participantsc 38 36
Benefit payments (funded plans)d (879) (902)
Benefit payments (unfunded plans)d (3) (4)
Disposals (43)
Actuarial loss on obligation 1,022 2,219
Benefit obligation at 31 December 20,742 19,882
Movements in fair value of plan assets during the year
Fair value of plan assets at 1 January 20,953 16,930
Exchange adjustment (819) 1,907
Expected return on plan assetsa e 1,486 1,339
Contributions by plan participantsc 38 36
Contributions by employers (funded plans) 397
Benefit payments (funded plans) (879) (902)
Disposals (43)
Actuarial gain on plan assetse 1,479 1,634
Fair value of plan assets at 31 Decemberf 22,612 20,953
Surplus at 31 December
1,870 1,071
a T he costs of managing the fund’s investments are treated as being part of the investment return, the costs of administering our pensions plan benefits are included in current service cost.
b The charge for special termination benefits represents the increased liability arising as a result of early retirements occurring as part of restructuring programmes.
c The contributions by plan participants are mostly comprised of contributions made under salary sacrifice with effect from January 2010.
d The benefit payments amount shown above comprises $867 million benefits plus $15 million of plan expenses incurred in the administration of the benefit.
e T he actual return on plan assets is made up of the sum of the expected return on plan assets and the actuarial gain on plan assets as disclosed above.
f R eflects $22,516 million of assets held in the BP Pension Fund (2009 $20,895 million) and $68 million held in the BP Global Pension Trust (2009 $58 million), with $28 million representing the company’s
share of the Merchant Navy Officers Pension Fund (2009 nil).
–
9
–
The parent company financial statements of BP p.l.c. on pages PC1 – PC16 do not form part of BP’s Annual Report on Form 20-F as filed with the SEC.
BP Annual Report and Form 20-F 2010 PC9