BP 2010 Annual Report Download - page 183
Download and view the complete annual report
Please find page 183 of the 2010 BP annual report below. You can navigate through the pages in the report by either clicking on the pages listed below, or by using the keyword search tool below to find specific information within the annual report.-
 1
1 -
2
-
3
-
4
-
5
-
6
-
7
-
8
-
9
-
10
-
11
-
12
-
13
-
14
-
15
-
16
-
17
-
18
-
19
-
20
-
21
-
22
-
23
-
24
-
25
-
26
-
27
-
28
-
29
-
30
-
31
-
32
-
33
-
34
-
35
-
36
-
37
-
38
-
39
-
40
-
41
-
42
-
43
-
44
-
45
-
46
-
47
-
48
-
49
-
50
-
51
-
52
-
53
-
54
-
55
-
56
-
57
-
58
-
59
-
60
-
61
-
62
-
63
-
64
-
65
-
66
-
67
-
68
-
69
-
70
-
71
-
72
-
73
-
74
-
75
-
76
-
77
-
78
-
79
-
80
-
81
-
82
-
83
-
84
-
85
-
86
-
87
-
88
-
89
-
90
-
91
-
92
-
93
-
94
-
95
-
96
-
97
-
98
-
99
-
100
-
101
-
102
-
103
-
104
-
105
-
106
-
107
-
108
-
109
-
110
-
111
-
112
-
113
-
114
-
115
-
116
-
117
-
118
-
119
-
120
-
121
-
122
-
123
-
124
-
125
-
126
-
127
-
128
-
129
-
130
-
131
-
132
-
133
-
134
-
135
-
136
-
137
-
138
-
139
-
140
-
141
-
142
-
143
-
144
-
145
-
146
-
147
-
148
-
149
-
150
-
151
-
152
-
153
-
154
-
155
-
156
-
157
-
158
-
159
-
160
-
161
-
162
-
163
-
164
-
165
-
166
-
167
-
168
-
169
-
170
-
171
-
172
-
 173
173 -
 174
174 -
 175
175 -
 176
176 -
 177
177 -
 178
178 -
 179
179 -
 180
180 -
 181
181 -
 182
182 -
 183
183 -
 184
184 -
 185
185 -
 186
186 -
 187
187 -
 188
188 -
 189
189 -
 190
190 -
 191
191 -
 192
192 -
 193
193 -
194
-
195
-
196
-
197
-
198
-
199
-
200
-
201
-
202
-
203
-
204
-
205
-
206
-
207
-
208
-
209
-
210
-
211
-
212
-
213
-
214
-
215
-
216
-
217
-
218
-
219
-
220
-
221
-
222
-
223
-
224
-
225
-
226
-
227
-
228
-
229
-
230
-
231
-
232
-
233
-
234
-
235
-
236
-
237
-
238
-
239
-
240
-
241
-
242
-
243
-
244
-
245
-
246
-
247
-
248
-
249
-
250
-
251
-
252
-
253
-
254
-
255
-
256
-
257
-
258
-
259
-
260
-
261
-
262
-
263
-
264
-
265
-
266
-
267
-
268
-
269
-
270
-
271
-
272
 |
 |

Notesonnancialstatements
Financial statements
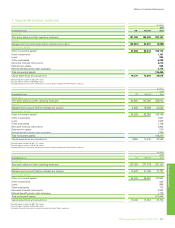
22.Property,plantandequipment
$million
Oil depots,
Plant, Fixtures, storage
Land Oil and machinery ttings and tanks and
and land gas and ofce Transport- service
improvements Buildings properties equipment equipment ation stations Total
Cost
At1January2010 3,786 2,918 157,197 41,599 3,022 12,441 10,295 231,258
Exchangeadjustments (85) (68) 3 35 (41) 28 (72) (200)
Additions 39 96 11,980 3,354 279 152 610 16,510
Acquisitions 2 3 1,931 41 5 15 – 1,997
Transfers – – 2,633 – – – – 2,633
Reclassiedasassetsheldforsale (6) (10) (6,610) (1,083) (87) (212) – (8,008)
Deletions (176) (104) (6,950) (1,119) (213) (208) (1,181) (9,951)
At31December2010 3,560 2,835 160,184 42,827 2,965 12,216 9,652 234,239
Depreciation
At1January2010 571 1,389 86,975 18,903 1,893 7,852 5,400 122,983
Exchangeadjustments 1 (46) – (19) (25) 16 (13) (86)
Chargefortheyear 34 82 8,024 1,492 291 268 606 10,797
Impairmentlosses 57 5 918 117 1 – 21 1,119
Reclassiedasassetsheldforsale – (8) (4,342) (514) (76) (97) – (5,037)
Deletions (91) (38) (3,528) (796) (208) (99) (940) (5,700)
At31December2010 572 1,384 88,047 19,183 1,876 7,940 5,074 124,076
Netbookamountat31December2010 2,988 1,451 72,137 23,644 1,089 4,276 4,578 110,163
Cost
At1January2009 3,964 2,742 146,813 37,905 3,045 12,295 10,345 217,109
Exchangeadjustments 148 85 2 877 83 66 546 1,807
Additions 59 313 11,928 3,743 145 115 739 17,042
Transfers – – 745 – – – – 745
Deletions (385) (222) (2,291) (926) (251) (35) (1,335) (5,445)
At31December2009 3,786 2,918 157,197 41,599 3,022 12,441 10,295 231,258
Depreciation
At1January2009 598 1,313 79,955 17,298 1,696 7,542 5,507 113,909
Exchangeadjustments 19 38 – 446 54 30 272 859
Chargefortheyear 31 102 8,951 1,372 302 289 618 11,665
Impairmentlosses 88 53 10 185 10 8 52 406
Deletions (165) (117) (1,941) (398) (169) (17) (1,049) (3,856)
At31December2009 571 1,389 86,975 18,903 1,893 7,852 5,400 122,983
Netbookamountat31December2009 3,215 1,529 70,222 22,696 1,129 4,589 4,895 108,275
Netbookamountat1January2009 3,366 1,429 66,858 20,607 1,349 4,753 4,838 103,200
Assetsheldundernanceleasesatnetbookamount
includedabove
At31December2010 – 14 236 386 – 7 18 661
At31December2009 – 14 225 110 – 7 19 375
Decommissioningassetatnetbookamount
includedabove Cost Depreciation Net
At31December2010 9,237 4,585 4,652
At31December2009 7,968 4,129 3,839
Assetsunderconstructionincludedabove
At31December2010 23,055
At31December2009 19,120
BPAnnualReportandForm20-F2010 181