BP 2010 Annual Report Download - page 236
Download and view the complete annual report
Please find page 236 of the 2010 BP annual report below. You can navigate through the pages in the report by either clicking on the pages listed below, or by using the keyword search tool below to find specific information within the annual report.-
 1
1 -
2
-
3
-
4
-
5
-
6
-
7
-
8
-
9
-
10
-
11
-
12
-
13
-
14
-
15
-
16
-
17
-
18
-
19
-
20
-
21
-
22
-
23
-
24
-
25
-
26
-
27
-
28
-
29
-
30
-
31
-
32
-
33
-
34
-
35
-
36
-
37
-
38
-
39
-
40
-
41
-
42
-
43
-
44
-
45
-
46
-
47
-
48
-
49
-
50
-
51
-
52
-
53
-
54
-
55
-
56
-
57
-
58
-
59
-
60
-
61
-
62
-
63
-
64
-
65
-
66
-
67
-
68
-
69
-
70
-
71
-
72
-
73
-
74
-
75
-
76
-
77
-
78
-
79
-
80
-
81
-
82
-
83
-
84
-
85
-
86
-
87
-
88
-
89
-
90
-
91
-
92
-
93
-
94
-
95
-
96
-
97
-
98
-
99
-
100
-
101
-
102
-
103
-
104
-
105
-
106
-
107
-
108
-
109
-
110
-
111
-
112
-
113
-
114
-
115
-
116
-
117
-
118
-
119
-
120
-
121
-
122
-
123
-
124
-
125
-
126
-
127
-
128
-
129
-
130
-
131
-
132
-
133
-
134
-
135
-
136
-
137
-
138
-
139
-
140
-
141
-
142
-
143
-
144
-
145
-
146
-
147
-
148
-
149
-
150
-
151
-
152
-
153
-
154
-
155
-
156
-
157
-
158
-
159
-
160
-
161
-
162
-
163
-
164
-
165
-
166
-
167
-
168
-
169
-
170
-
171
-
172
-
173
-
174
-
175
-
176
-
177
-
178
-
179
-
180
-
181
-
182
-
183
-
184
-
185
-
186
-
187
-
188
-
189
-
190
-
191
-
192
-
193
-
194
-
195
-
196
-
197
-
198
-
199
-
200
-
201
-
202
-
203
-
204
-
205
-
206
-
207
-
208
-
209
-
210
-
211
-
212
-
213
-
214
-
215
-
216
-
217
-
218
-
219
-
220
-
221
-
222
-
223
-
224
-
225
-
 226
226 -
 227
227 -
 228
228 -
 229
229 -
 230
230 -
 231
231 -
 232
232 -
 233
233 -
 234
234 -
 235
235 -
 236
236 -
 237
237 -
 238
238 -
 239
239 -
 240
240 -
 241
241 -
 242
242 -
 243
243 -
 244
244 -
 245
245 -
 246
246 -
247
-
248
-
249
-
250
-
251
-
252
-
253
-
254
-
255
-
256
-
257
-
258
-
259
-
260
-
261
-
262
-
263
-
264
-
265
-
266
-
267
-
268
-
269
-
270
-
271
-
272
 |
 |

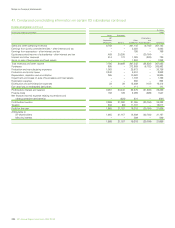
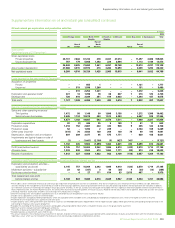
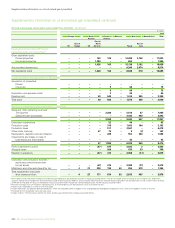
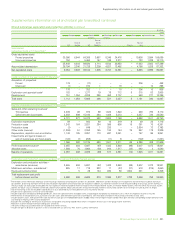
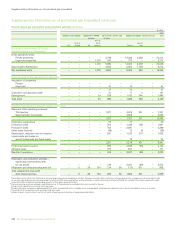
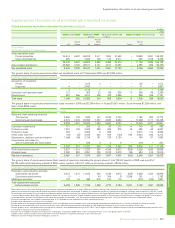
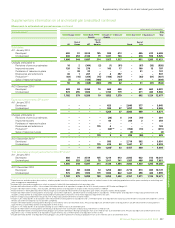
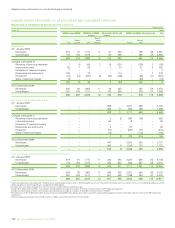
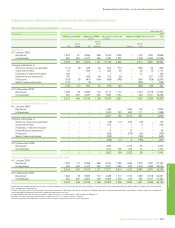
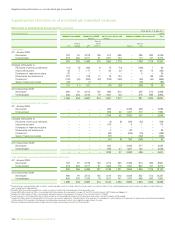
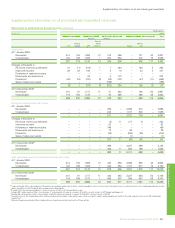
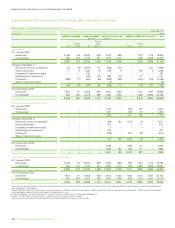
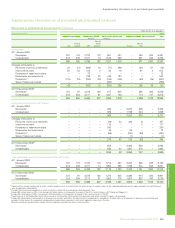
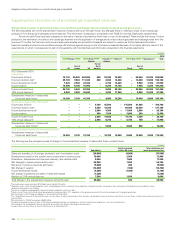
Supplementaryinformationonoilandnaturalgas(unaudited)
Supplementaryinformationonoilandnaturalgas(unaudited)continued
Movements in estimated net proved reserves
millionbarrels
Crude oila 2010
Europe North South Africa Asia Australasia Total
America America
Rest of
Rest of North Rest of
UK Europe USe America Russia Asia
Subsidiaries
At1January2010
Developed 403 83 1,862 11 49 422 – 182 58 3,070
Undeveloped 291 184 1,211 1 56 454 – 334 57 2,588
694 267 3,073 12 105 876 – 516 115 5,658
Changesattributableto
Revisionsofpreviousestimates 20 3 (45) 1 (1) (62) – (62) – (146)
Improvedrecovery 100 9 133 – 17 14 – 145 3 421
Purchasesofreserves-in-place – 33 6 – – – – 38 – 77
Discoveriesandextensions 31 1 80 – – 19 – – – 131
Productionbj(50) (15) (211) (2) (19) (87) – (43) (12) (439)
Salesofreserves-in-place – – (117) (11) – (15) – – – (143)
101 31 (154) (12) (3) (131) – 78 (9) (99)
At31December2010cg
Developed 364 77 1,729 – 44 371 – 269 48 2,902
Undeveloped 431 221 1,190 – 58 374 – 325 58 2,657
795 298 2,919 – 102 745 – 594 106 5,559
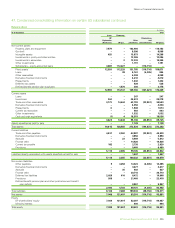
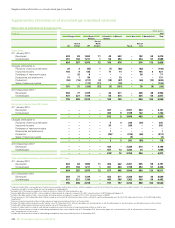
Equity-accountedentities(BPshare)f
At1January2010
Developed – – – – 407 – 2,351 363 – 3,121
Undeveloped – – – – 405 9 1,198 120 – 1,732
– – – – 812 9 3,549 483 – 4,853
Changesattributableto
Revisionsofpreviousestimates – – – – 4 3 248 (20) – 235
Improvedrecovery – – – – 33 – 269 – – 302
Purchasesofreserves-in-place – – – – – – – – – –
Discoveriesandextensions – – – – 1 – – – – 1
Production – – – – (35)i k – (313) (69) – (417)
Salesofreserves-in-place – – – – – – (3) – – (3)
– – – – 3 3 201 (89) – 118
At31December2010d
Developed – – – – 408 – 2,388 370 – 3,166
Undeveloped – – – – 407 12 1,362 24 – 1,805
– – – – 815h 12 3,750 394 – 4,971
Totalsubsidiariesandequity-accountedentities(BPshare)
At1January2010
Developed 403 83 1,862 11 456 422 2,351 545 58 6,191
Undeveloped 291 184 1,211 1 461 463 1,198 454 57 4,320
694 267 3,073 12 917 885 3,549 999 115 10,511
At31December2010
Developed 364 77 1,729 – 452 371 2,388 639 48 6,068
Undeveloped 431 221 1,190 – 465 386 1,362 349 58 4,462
795 298 2,919 – 917 757 3,750 988 106 10,530
aC rudeoilincludesNGLsandcondensate.Provedreservesexcluderoyaltiesduetoothers,whetherpayableincashorinkind,wheretheroyaltyownerhasadirectinterestintheunderlyingproductionand
theoptionandabilitytomakeliftingandsalesarrangementsindependently.
bEx
cludesNGLsfromprocessingplantsinwhichaninterestisheldof29thousandbarrelsaday.
cIncludes643millionbarrelsofNGLs.Alsoincludes22millionbarrelsofcrudeoilinrespectofthe30%minorityinterestinBPTrinidadandTobagoLLC.
dIncludes18millionbarrelsofNGLs.Alsoincludes254millionbarrelsofcrudeoilinrespectofthe7.03%minorityinterestinTNK-BP.
eProvedreservesinthePrudhoeBayeldinAlaskaincludeanestimated78millionbarrelsuponwhichanetprotsroyaltywillbepayableoverthelifeoftheeldunderthetermsoftheBPPrudhoeBay
RoyaltyTrust.
fV
olumesofequity-accountedentitiesincludevolumesofequity-accountedinvestmentsofthoseentities.
gIncludes70millionbarrelsrelatingtoassetsheldforsaleat31December2010.Amountsbyregionare:6millionbarrelsinUS;30millionbarrelsinSouthAmerica;and34millionbarrelsinRestofAsia.
hIncludes801millionbarrelsrelatingtoassetsheldforsaleat31December2010.
iIncludes4millionbarrelsofcrudeoilsoldrelatingtoproductionsinceclassicationofequity-accountedentitiesasheldforsale.
jIncludes15millionbarrelsofcrudeoilsoldrelatingtoproductionfromassetsheldforsaleat31December2010.Amountsbyregionare:2millionbarrelsinUS;6millionbarrelsinSouthAmerica;
and7millionbarrelsinRestofAsia.
kIncludes
35millionbarrelsofcrudeoilsoldrelatingtoproductionfromassetsheldforsaleat31December2010.
234BPAnnualReportandForm20-F2010