BP 2010 Annual Report Download - page 231
Download and view the complete annual report
Please find page 231 of the 2010 BP annual report below. You can navigate through the pages in the report by either clicking on the pages listed below, or by using the keyword search tool below to find specific information within the annual report.-
 1
1 -
2
-
3
-
4
-
5
-
6
-
7
-
8
-
9
-
10
-
11
-
12
-
13
-
14
-
15
-
16
-
17
-
18
-
19
-
20
-
21
-
22
-
23
-
24
-
25
-
26
-
27
-
28
-
29
-
30
-
31
-
32
-
33
-
34
-
35
-
36
-
37
-
38
-
39
-
40
-
41
-
42
-
43
-
44
-
45
-
46
-
47
-
48
-
49
-
50
-
51
-
52
-
53
-
54
-
55
-
56
-
57
-
58
-
59
-
60
-
61
-
62
-
63
-
64
-
65
-
66
-
67
-
68
-
69
-
70
-
71
-
72
-
73
-
74
-
75
-
76
-
77
-
78
-
79
-
80
-
81
-
82
-
83
-
84
-
85
-
86
-
87
-
88
-
89
-
90
-
91
-
92
-
93
-
94
-
95
-
96
-
97
-
98
-
99
-
100
-
101
-
102
-
103
-
104
-
105
-
106
-
107
-
108
-
109
-
110
-
111
-
112
-
113
-
114
-
115
-
116
-
117
-
118
-
119
-
120
-
121
-
122
-
123
-
124
-
125
-
126
-
127
-
128
-
129
-
130
-
131
-
132
-
133
-
134
-
135
-
136
-
137
-
138
-
139
-
140
-
141
-
142
-
143
-
144
-
145
-
146
-
147
-
148
-
149
-
150
-
151
-
152
-
153
-
154
-
155
-
156
-
157
-
158
-
159
-
160
-
161
-
162
-
163
-
164
-
165
-
166
-
167
-
168
-
169
-
170
-
171
-
172
-
173
-
174
-
175
-
176
-
177
-
178
-
179
-
180
-
181
-
182
-
183
-
184
-
185
-
186
-
187
-
188
-
189
-
190
-
191
-
192
-
193
-
194
-
195
-
196
-
197
-
198
-
199
-
200
-
201
-
202
-
203
-
204
-
205
-
206
-
207
-
208
-
209
-
210
-
211
-
212
-
213
-
214
-
215
-
216
-
217
-
218
-
219
-
220
-
 221
221 -
 222
222 -
 223
223 -
 224
224 -
 225
225 -
 226
226 -
 227
227 -
 228
228 -
 229
229 -
 230
230 -
 231
231 -
 232
232 -
 233
233 -
 234
234 -
 235
235 -
 236
236 -
 237
237 -
 238
238 -
 239
239 -
 240
240 -
 241
241 -
242
-
243
-
244
-
245
-
246
-
247
-
248
-
249
-
250
-
251
-
252
-
253
-
254
-
255
-
256
-
257
-
258
-
259
-
260
-
261
-
262
-
263
-
264
-
265
-
266
-
267
-
268
-
269
-
270
-
271
-
272
 |
 |

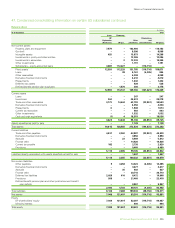
Supplementaryinformationonoilandnaturalgas(unaudited)
Financial statements
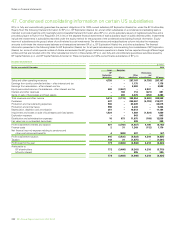
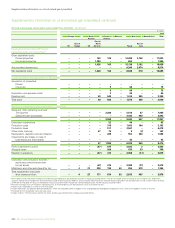
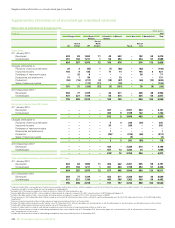
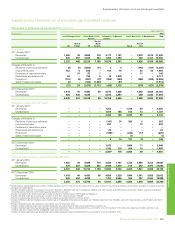
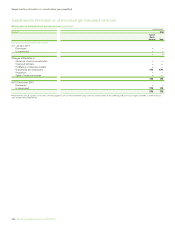
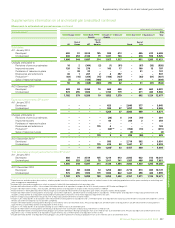
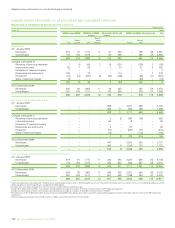
Supplementaryinformationonoilandnaturalgas(unaudited)continued
Oil and natural gas exploration and production activities
$million
2010
Europe North South Africa Asia Australasia Total
America America
Rest of
Rest of North Rest of
UK Europe US America Russia Asia
Subsidiariesa
Capitalizedcostsat31Decemberbj
Grosscapitalizedcosts
Provedproperties 36,161 7,846 67,724 278 6,047 27,014 – 11,497 3,088 159,655
Unprovedproperties 787 179 5,968 1,363 220 2,694 – 1,113 1,149 13,473
36,948 8,025 73,692 1,641 6,267 29,708 – 12,610 4,237 173,128
Accumulateddepreciation 27,688 3,515 33,972 216 3,282 13,893 – 4,569 1,205 88,340
Netcapitalizedcosts 9,260 4,510 39,720 1,425 2,985 15,815 – 8,041 3,032 84,788
Costsincurredfortheyearended31Decemberbj
Acquisitionofpropertiesc
Proved – – 655 1 – – – 1,121 – 1,777
Unproved – 519 1,599 1,200 – – – 151 – 3,469
– 519 2,254 1,201 – – – 1,272 – 5,246
Explorationandappraisalcostsd401 13 1,096 78 68 607 7 316 120 2,706
Development 726 816 3,034 251 414 3,003 – 1,244 187 9,675
Totalcosts 1,127 1,348 6,384 1,530 482 3,610 7 2,832 307 17,627
Resultsofoperationsfortheyearended31December
Salesandotheroperatingrevenuese
Thirdparties 1,472 58 1,148 90 1,896 3,158 – 1,272 1,398 10,492
Salesbetweenbusinesses 3,405 1,134 18,819 453 1,574 4,353 – 6,697 929 37,364
4,877 1,192 19,967 543 3,470 7,511 – 7,969 2,327 47,856
Explorationexpenditure 82 (2) 465 25 9 189 7 51 17 843
Productioncosts 1,018 152 2,867 240 445 938 9 365 124 6,158
Productiontaxes 52 – 1,093 2 249 – – 3,764 109 5,269
Othercosts(income)f(316) 76 3,502 129 209 130 76 90 195 4,091
Depreciation,depletionandamortization 897 209 3,477 95 575 1,771 – 829 168 8,021
Impairmentsand(gains)lossesonsaleof
businessesandxedassets (1) – (1,441) (2,190) (3) (427) 341k – – (3,721)
1,732 435 9,963 (1,699) 1,484 2,601 433 5,099 613 20,661
Prot(loss)beforetaxationg3,145 757 10,004 2,242 1,986 4,910 (433) 2,870 1,714 27,195
Allocabletaxes 1,333 530 3,504 610 1,084 1,771 (23) 813 410 10,032
Resultsofoperations 1,812 227 6,500 1,632 902 3,139 (410) 2,057 1,304 17,163
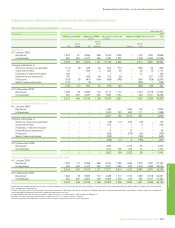
ExplorationandProductionsegmentreplacementcostprotbeforeinterestandtax
Explorationandproductionactivities–
subsidiaries(asabove) 3,145 757 10,004 2,242 1,986 4,910 (433) 2,870 1,714 27,195
Midstreamactivities–subsidiariesh23 42 (347) 3 49 (26) 4 (23) (13) (288)
Equity-accountedentitiesi– 4 27 171 614 63 2,613 487 – 3,979
Totalreplacementcostprot
beforeinterestandtax 3,168 803 9,684 2,416 2,649 4,947 2,184 3,334 1,701 30,886
aT
hesetablescontaininformationrelatingtooilandnaturalgasexplorationandproductionactivitiesofsubsidiaries.TheydonotincludeanycostsrelatingtotheGulfofMexicooilspill.Midstream
activitiesrelatingtothemanagementandownershipofcrudeoilandnaturalgaspipelines,processingandexportterminalsandLNGprocessingfacilitiesandtransportationareexcluded.Inaddition,
ourmidstreamactivitiesofmarketingandtradingofnaturalgas,powerandNGLsintheUS,Canada,UKandEuropeareexcluded.ThemostsignicantmidstreampipelineinterestsincludetheTrans-
AlaskaPipelineSystem,theFortiesPipelineSystem,theCentralAreaTransmissionSystempipeline,theSouthCaucasusPipelineandtheBaku-Tbilisi-Ceyhanpipeline.MajorLNGactivitiesarelocated
inTrinidad,IndonesiaandAustraliaandBPisalsoinvestingintheLNGbusinessinAngola.
b
Decommissioning
assetsareincludedincapitalizedcostsat31Decemberbutareexcludedfromcostsincurredfortheyear.
c
Includescostscapitalizedasaresultofassetexchanges.
d
Includesexplorationandappraisaldrillingexpenditures,whicharecapitalizedwithinintangibleassets,andgeologicalandgeophysicalexplorationcosts,whicharechargedtoincomeasincurred.
e
Presentednetoftransportationcosts,purchasesandsalestaxes.
fIncludespropertytaxes,othergovernmenttakeandthefairvaluelossonembeddedderivativesof$309million.TheUKregionincludesa$822milliongainoffsetbycorrespondingchargesprimarilyinthe
US,relatingtothegroupself-insuranceprogramme.
g
Ex
cludestheunwindingofthediscountonprovisionsandpayablesamountingto$313millionwhichisincludedinnancecostsinthegroupincomestatement.
h
Midstreamactivitiesexcludeinventoryholdinggainsandlosses.
i
Theprotsofequity-accountedentitiesareincludedafterinterestandtax.
jExcludesbalancesassociatedwithassetsheldforsale.
kThisamountrepresentsthewrite-downofourinvestmentinSakhalin.Aportionofthesecostswaspreviouslyreportedwithincapitalizedcostsofequityaccountedentitieswiththeremainderpreviously
reportedasaloan,whichwasnotincludedinthedisclosuresofoilandnaturalgasexplorationandproductionactivities.
BPAnnualReportandForm20-F2010 229