BP 2010 Annual Report Download - page 14
Download and view the complete annual report
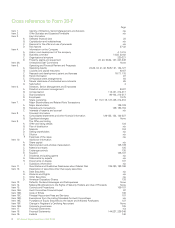
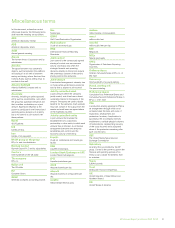
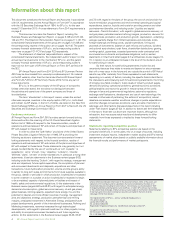
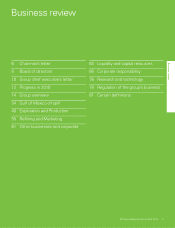
Please find page 14 of the 2010 BP annual report below. You can navigate through the pages in the report by either clicking on the pages listed below, or by using the keyword search tool below to find specific information within the annual report.-
 1
1 -
2
-
3
-
 4
4 -
 5
5 -
 6
6 -
 7
7 -
 8
8 -
 9
9 -
 10
10 -
 11
11 -
 12
12 -
 13
13 -
 14
14 -
 15
15 -
 16
16 -
 17
17 -
 18
18 -
 19
19 -
 20
20 -
 21
21 -
 22
22 -
 23
23 -
 24
24 -
25
-
26
-
27
-
28
-
29
-
30
-
31
-
32
-
33
-
34
-
35
-
36
-
37
-
38
-
39
-
40
-
41
-
42
-
43
-
44
-
45
-
46
-
47
-
48
-
49
-
50
-
51
-
52
-
53
-
54
-
55
-
56
-
57
-
58
-
59
-
60
-
61
-
62
-
63
-
64
-
65
-
66
-
67
-
68
-
69
-
70
-
71
-
72
-
73
-
74
-
75
-
76
-
77
-
78
-
79
-
80
-
81
-
82
-
83
-
84
-
85
-
86
-
87
-
88
-
89
-
90
-
91
-
92
-
93
-
94
-
95
-
96
-
97
-
98
-
99
-
100
-
101
-
102
-
103
-
104
-
105
-
106
-
107
-
108
-
109
-
110
-
111
-
112
-
113
-
114
-
115
-
116
-
117
-
118
-
119
-
120
-
121
-
122
-
123
-
124
-
125
-
126
-
127
-
128
-
129
-
130
-
131
-
132
-
133
-
134
-
135
-
136
-
137
-
138
-
139
-
140
-
141
-
142
-
143
-
144
-
145
-
146
-
147
-
148
-
149
-
150
-
151
-
152
-
153
-
154
-
155
-
156
-
157
-
158
-
159
-
160
-
161
-
162
-
163
-
164
-
165
-
166
-
167
-
168
-
169
-
170
-
171
-
172
-
173
-
174
-
175
-
176
-
177
-
178
-
179
-
180
-
181
-
182
-
183
-
184
-
185
-
186
-
187
-
188
-
189
-
190
-
191
-
192
-
193
-
194
-
195
-
196
-
197
-
198
-
199
-
200
-
201
-
202
-
203
-
204
-
205
-
206
-
207
-
208
-
209
-
210
-
211
-
212
-
213
-
214
-
215
-
216
-
217
-
218
-
219
-
220
-
221
-
222
-
223
-
224
-
225
-
226
-
227
-
228
-
229
-
230
-
231
-
232
-
233
-
234
-
235
-
236
-
237
-
238
-
239
-
240
-
241
-
242
-
243
-
244
-
245
-
246
-
247
-
248
-
249
-
250
-
251
-
252
-
253
-
254
-
255
-
256
-
257
-
258
-
259
-
260
-
261
-
262
-
263
-
264
-
265
-
266
-
267
-
268
-
269
-
270
-
271
-
272
 |
 |

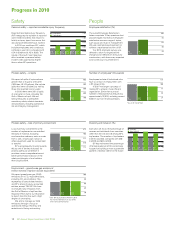
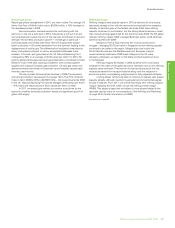
Progress in 2010
Safety
Personal safety – reported recordable injury frequency
Reported recordable injury frequency
(RIF) measures the number of reported
work-related incidents that result in a
fatality or injury (apart from minor first
aid cases) per 200,000 hours worked.
In 2010 our workforce RIF, which
includes employees and contractors
combined, was 0.61, compared with
0.34 in 2009 and 0.43 in 2008. The
nature of the Gulf Coast response
effort resulted in personal safety
incident rates significantly higher
than in other BP operations.
Employees
Contractors
0.25
0.35
2008
0.50
2008
0.23
2009
0.43
2009
0.25
2010
0.84
2010
1.25
1.00
0.75
0.50
Process safety – oil spills
We report all spills of hydrocarbons
greater than or equal to one barrel
(159 litres, 42 US gallons). We include
spills that were contained, as well as
those that reached land or water.
In 2010 there were 261 oil spills
of one barrel or more, including the
Gulf of Mexico oil spill. We are
taking measures to strengthen
mandatory safety-related standards
and processes, including operational
risk and integrity management.
Process safety – loss of primary containment
Loss of primary containment is the
number of unplanned or uncontrolled
releases of material, excluding
non-hazardous releases, such as water
from a tank, vessel, pipe, railcar or
other equipment used for containment
or transfer.
BP is progressively moving towards
this as one of the key indicators for
process safety, as we believe it
provides a more comprehensive and
better performance indicator of the
safety and integrity of our facilities
than oil spills alone.
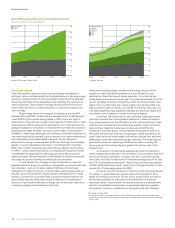
Environment – greenhouse gas emissionsa
(million tonnes of carbon dioxide equivalent)
We report greenhouse gas (GHG)
emissions on a CO2-equivalent basis,
including CO2 and methane. This
represents all consolidated entities
and BP’s share of equity-accounted
entities, except TNK-BP. We have
not included any emissions from
the Gulf of Mexico oil spill and the
response effort due to our reluctance
to report data that has such a high
degree of uncertainty.
We aim to manage our GHG
emissions through a focus on
operational energy efficiency and
reductions in flaring and venting.
a See BP Sustainability Review 2010
for more information on our GHG
emissions performance.
People
Employee satisfaction (%)
The overall Employee Satisfaction
Index comprises 10 key questions that
provide insight into levels of employee
satisfaction across a range of topics,
such as pay and trust in management.
We use a sample-based approach to
achieve a representative view of BP.
Our 2010 employee survey was
delayed to allow for organizational
changes to be reflected in the survey
construction, with the survey expected
to be carried out in summer 2011.
Number of employeesa (thousands)
Employees include all individuals who
have a contract of employment with
a BP group entity.
In 2007 we began a process of
making BP a simpler, more efficient
organization. Since then our total
number of employees has reduced by
approximately 18,000, including around
9,200 in our non-retail businesses.
a As at 31 December.
Diversity and inclusion (%)
Each year we record the percentage of
women and individuals from countries
other than the UK and US among BP’s
top leaders. The number of top leaders
in 2010 was 482, compared with 492
in 2009 and 583 in 2008.
BP has maintained the percentage
of female leaders in 2010 and remains
focused on building a more sustainable
pipeline of diverse talent for the future.
5
14
2008
19
2008
14
2009
21
2009
14
2010
19
2010
25
20
15
10
Women
Non-UK/US
12 BP Annual Report and Form 20-F 2010