BP 2010 Annual Report Download - page 173
Download and view the complete annual report
Please find page 173 of the 2010 BP annual report below. You can navigate through the pages in the report by either clicking on the pages listed below, or by using the keyword search tool below to find specific information within the annual report.-
 1
1 -
2
-
3
-
4
-
5
-
6
-
7
-
8
-
9
-
10
-
11
-
12
-
13
-
14
-
15
-
16
-
17
-
18
-
19
-
20
-
21
-
22
-
23
-
24
-
25
-
26
-
27
-
28
-
29
-
30
-
31
-
32
-
33
-
34
-
35
-
36
-
37
-
38
-
39
-
40
-
41
-
42
-
43
-
44
-
45
-
46
-
47
-
48
-
49
-
50
-
51
-
52
-
53
-
54
-
55
-
56
-
57
-
58
-
59
-
60
-
61
-
62
-
63
-
64
-
65
-
66
-
67
-
68
-
69
-
70
-
71
-
72
-
73
-
74
-
75
-
76
-
77
-
78
-
79
-
80
-
81
-
82
-
83
-
84
-
85
-
86
-
87
-
88
-
89
-
90
-
91
-
92
-
93
-
94
-
95
-
96
-
97
-
98
-
99
-
100
-
101
-
102
-
103
-
104
-
105
-
106
-
107
-
108
-
109
-
110
-
111
-
112
-
113
-
114
-
115
-
116
-
117
-
118
-
119
-
120
-
121
-
122
-
123
-
124
-
125
-
126
-
127
-
128
-
129
-
130
-
131
-
132
-
133
-
134
-
135
-
136
-
137
-
138
-
139
-
140
-
141
-
142
-
143
-
144
-
145
-
146
-
147
-
148
-
149
-
150
-
151
-
152
-
153
-
154
-
155
-
156
-
157
-
158
-
159
-
160
-
161
-
162
-
 163
163 -
 164
164 -
 165
165 -
 166
166 -
 167
167 -
 168
168 -
 169
169 -
 170
170 -
 171
171 -
 172
172 -
 173
173 -
 174
174 -
 175
175 -
 176
176 -
 177
177 -
 178
178 -
 179
179 -
 180
180 -
 181
181 -
 182
182 -
 183
183 -
184
-
185
-
186
-
187
-
188
-
189
-
190
-
191
-
192
-
193
-
194
-
195
-
196
-
197
-
198
-
199
-
200
-
201
-
202
-
203
-
204
-
205
-
206
-
207
-
208
-
209
-
210
-
211
-
212
-
213
-
214
-
215
-
216
-
217
-
218
-
219
-
220
-
221
-
222
-
223
-
224
-
225
-
226
-
227
-
228
-
229
-
230
-
231
-
232
-
233
-
234
-
235
-
236
-
237
-
238
-
239
-
240
-
241
-
242
-
243
-
244
-
245
-
246
-
247
-
248
-
249
-
250
-
251
-
252
-
253
-
254
-
255
-
256
-
257
-
258
-
259
-
260
-
261
-
262
-
263
-
264
-
265
-
266
-
267
-
268
-
269
-
270
-
271
-
272
 |
 |

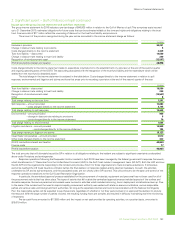
Notesonnancialstatements
Financial statements
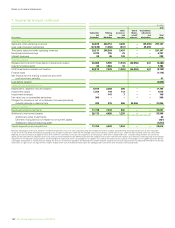
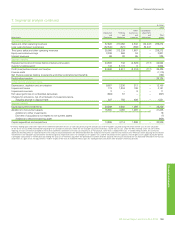
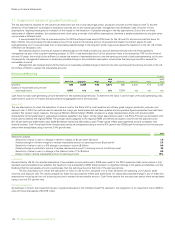
7.Segmentalanalysiscontinued
$million
2010
Bygeographicalarea US Non-US Total
Revenues
Thirdpartysalesandotheroperatingrevenuesa 101,768 195,339 297,107
Results
Replacementcostprot(loss)beforeinterestandtaxation (30,087) 24,601 (5,486)
Non-currentassets
Othernon-currentassetsbc 67,498 92,614 160,112
Otherinvestments 1,191
Loans 894
Otherreceivables 6,298
Derivativenancialinstruments 4,210
Deferredtaxassets 528
Denedbenetpensionplansurpluses 2,176
Totalnon-currentassets 175,409
Capitalexpenditureandacquisitions 10,370 12,646 23,016
a
Non-USregionincludesUK$62,794million.
b
Non-USregionincludesUK$16,650million.
c
Excludingnancialinstruments,deferredtaxassetsandpost-employmentbenetplansurpluses.
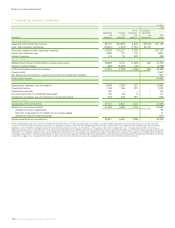
$million
2009
Bygeographicalarea US Non-US Total
Revenues
Thirdpartysalesandotheroperatingrevenuesa 83,982 155,290 239,272
Results
Replacementcostprotbeforeinterestandtaxation 2,806 19,698 22,504
Non-currentassets
Othernon-currentassetsbc 64,529 93,580 158,109
Otherinvestments 1,567
Loans 1,039
Otherreceivables 1,729
Derivativenancialinstruments 3,965
Deferredtaxassets 516
Denedbenetpensionplansurpluses 1,390
Totalnon-currentassets 168,315
Capitalexpenditureandacquisitions 9,865 10,444 20,309
a
Non-USregionincludesUK$51,172million.
b
Non-USregionincludesUK$16,713million.
c
Excludingnancialinstruments,deferredtaxassetsandpost-employmentbenetplansurpluses.
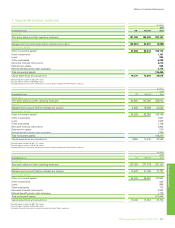
$million
2008
Bygeographicalarea US Non-US Total
Revenues
Thirdpartysalesandotheroperatingrevenuesa 123,364 237,779 361,143
Results
Replacementcostprotbeforeinterestandtaxation 10,678 31,049 41,727
Non-currentassets
Othernon-currentassetsbc 62,679 89,823 152,502
Otherinvestments 855
Loans 995
Otherreceivables 710
Derivativenancialinstruments 5,054
Denedbenetpensionplansurpluses 1,738
Totalnon-currentassets 161,854
Capitalexpenditureandacquisitions 16,046 14,654 30,700
a
Non-USregionincludesUK$81,773million.
b
Non-USregionincludesUK$15,990million.
c
Excludingnancialinstruments,andpost-employmentbenetplansurpluses.
BPAnnualReportandForm20-F2010 171