BP 2010 Annual Report Download - page 239
Download and view the complete annual report
Please find page 239 of the 2010 BP annual report below. You can navigate through the pages in the report by either clicking on the pages listed below, or by using the keyword search tool below to find specific information within the annual report.-
 1
1 -
2
-
3
-
4
-
5
-
6
-
7
-
8
-
9
-
10
-
11
-
12
-
13
-
14
-
15
-
16
-
17
-
18
-
19
-
20
-
21
-
22
-
23
-
24
-
25
-
26
-
27
-
28
-
29
-
30
-
31
-
32
-
33
-
34
-
35
-
36
-
37
-
38
-
39
-
40
-
41
-
42
-
43
-
44
-
45
-
46
-
47
-
48
-
49
-
50
-
51
-
52
-
53
-
54
-
55
-
56
-
57
-
58
-
59
-
60
-
61
-
62
-
63
-
64
-
65
-
66
-
67
-
68
-
69
-
70
-
71
-
72
-
73
-
74
-
75
-
76
-
77
-
78
-
79
-
80
-
81
-
82
-
83
-
84
-
85
-
86
-
87
-
88
-
89
-
90
-
91
-
92
-
93
-
94
-
95
-
96
-
97
-
98
-
99
-
100
-
101
-
102
-
103
-
104
-
105
-
106
-
107
-
108
-
109
-
110
-
111
-
112
-
113
-
114
-
115
-
116
-
117
-
118
-
119
-
120
-
121
-
122
-
123
-
124
-
125
-
126
-
127
-
128
-
129
-
130
-
131
-
132
-
133
-
134
-
135
-
136
-
137
-
138
-
139
-
140
-
141
-
142
-
143
-
144
-
145
-
146
-
147
-
148
-
149
-
150
-
151
-
152
-
153
-
154
-
155
-
156
-
157
-
158
-
159
-
160
-
161
-
162
-
163
-
164
-
165
-
166
-
167
-
168
-
169
-
170
-
171
-
172
-
173
-
174
-
175
-
176
-
177
-
178
-
179
-
180
-
181
-
182
-
183
-
184
-
185
-
186
-
187
-
188
-
189
-
190
-
191
-
192
-
193
-
194
-
195
-
196
-
197
-
198
-
199
-
200
-
201
-
202
-
203
-
204
-
205
-
206
-
207
-
208
-
209
-
210
-
211
-
212
-
213
-
214
-
215
-
216
-
217
-
218
-
219
-
220
-
221
-
222
-
223
-
224
-
225
-
226
-
227
-
228
-
 229
229 -
 230
230 -
 231
231 -
 232
232 -
 233
233 -
 234
234 -
 235
235 -
 236
236 -
 237
237 -
 238
238 -
 239
239 -
 240
240 -
 241
241 -
 242
242 -
 243
243 -
 244
244 -
 245
245 -
 246
246 -
 247
247 -
 248
248 -
 249
249 -
250
-
251
-
252
-
253
-
254
-
255
-
256
-
257
-
258
-
259
-
260
-
261
-
262
-
263
-
264
-
265
-
266
-
267
-
268
-
269
-
270
-
271
-
272
 |
 |

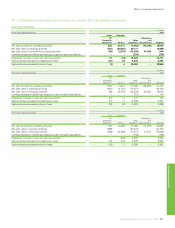
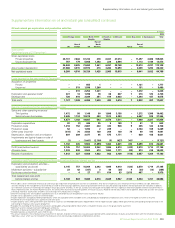
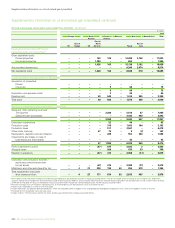
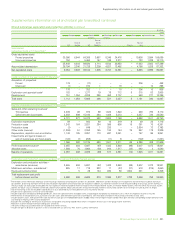
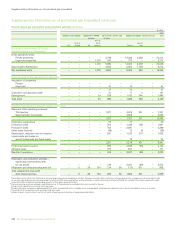
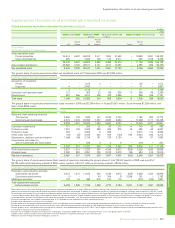
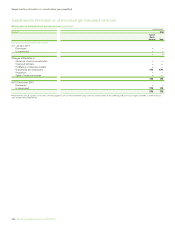
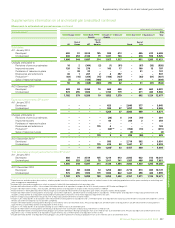
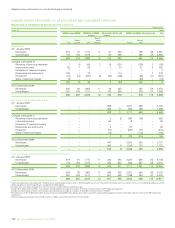
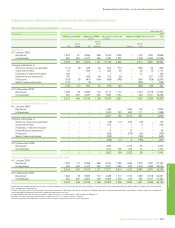
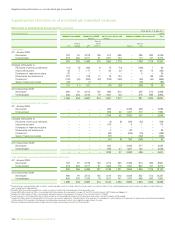
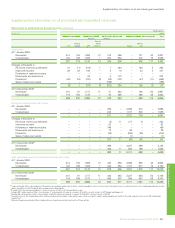
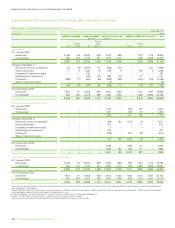
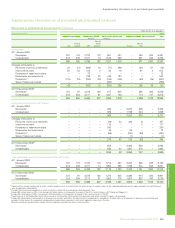
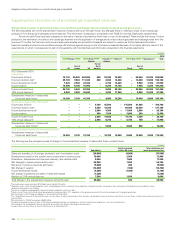
Supplementaryinformationonoilandnaturalgas(unaudited)
Financial statements
m
Supplementaryinformationonoilandnaturalgas(unaudited)continued
Movements in estimated net proved reserves continued
millionbarrelsofoilequivalent
Total hydrocarbonsa 2010
Europe North South Africa Asia Australasia Total
America America
Rest of
Rest of North Rest of
UK Europe USe America Russia Asia
Subsidiaries
At1January2010
Developed 680 91 3,514 135 596 613 – 455 612 6,696
Undeveloped 406 253 2,183 79 1,331 704 – 376 593 5,925
1,086 344 5,697 214 1,927 1,317 – 831 1,205 12,621
Changesattributableto
Revisionsofpreviousestimates 18 2 (364) (2) (1) (61) – (87) (33) (528)
Improvedrecovery 126 10 276 – 105 17 – 160 13 707
Purchasesofreserves-in-place – 38 22 – – – – 41 – 101
Discoveriesandextensions 36 1 207 2 4 257 – – – 507
Productionbfl(83) (16) (359) (15) (183) (127) – (83) (61) (927)
Salesofreserves-in-place (1) – (190) (189) – (24) – – – (404)
96 35 (408) (204) (75) 62 – 31 (81) (544)
At31December2010ci
Developed 608 84 3,366 10 660 600 – 491 662 6,481
Undeveloped 574 295 1,923 – 1,192 779 – 371 462 5,596
1,182 379 5,289 10 1,852 1,379 – 862 1,124 12,077
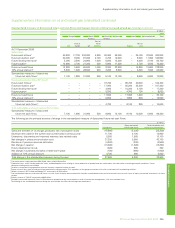
Equity-accountedentities(BPshare)g
At1January2010
Developed – – – – 623 – 2,645 377 – 3,645
Undeveloped – – – – 580 37 1,287 122 – 2,026
– – – – 1,203 37 3,932 499 – 5,671
Changesattributableto
Revisionsofpreviousestimates – – – – (20) 6 314 (19) – 281
Improvedrecovery – – – – 83 – 269 2 – 354
Purchasesofreserves-in-place – – – – – – – – – –
Discoveriesandextensions – – – 179 4 – – – – 183
Productionbf– – – – (64)k m – (354) (73) – (491)
Salesofreserves-in-place – – – – – – (4) – – (4)
– – – 179 3 6 225 (90) – 323
At31December2010d
Developed – – – – 593 – 2,716 382 – 3,691
Undeveloped – – – 179 613 43 1,441 27 – 2,303
– – – 179 1,206j 43 4,157 409 – 5,994
Totalsubsidiariesandequity-accountedentities(BPshare)h
At1January2010
Developed 680 91 3,514 135 1,219 613 2,645 832 612 10,341
Undeveloped 406 253 2,183 79 1,911 741 1,287 498 593 7,951
1,086 344 5,697 214 3,130 1,354 3,932 1,330 1,205 18,292
At31December2010
Developed 608 84 3,366 10 1,253 600 2,716 873 662 10,172
Undeveloped 574 295 1,923 179 1,805 822 1,441 398 462 7,899
1,182 379 5,289 189 3,058 1,422 4,157 1,271 1,124 18,071
aP rovedreservesexcluderoyaltiesduetoothers,whetherpayableincashorinkind,wheretheroyaltyownerhasadirectinterestintheunderlyingproductionandtheoptionandabilitytomakeliftingand
salesarrangementsindependently.
bEx
cludesNGLsfromprocessingplantsinwhichaninterestisheldof29thousandbarrelsofoilequivalentaday.
cIncludes643millionbarrelsofNGLs.Alsoincludes526millionbarrelsofoilequivalentinrespectofthe30%minorityinterestinBPTrinidadandTobagoLLC.
dIncludes18millionbarrelsofNGLs.Alsoincludes278millionbarrelsofoilequivalentinrespectoftheminorityinterestinTNK-BP.
eProvedreservesinthePrudhoeBayeldinAlaskaincludeanestimated78millionbarrelsofoilequivalentuponwhichanetprotsroyaltywillbepayable.
fIncludes35millionbarrelsofoilequivalentofnaturalgasconsumedinoperations,28millionbarrelsofoilequivalentinsubsidiaries,7millionbarrelsofoilequivalentinequity-accountedentitiesand
excludes2millionbarrelsofoilequivalentofproducednon-hydrocarboncomponentswhichmeetregulatoryrequirementsforsales.
gV
olumesofequity-accountedentitiesincludevolumesofequity-accountedinvestmentsofthoseentities.
hIncludes1,311millionbarrelsofoilequivalent(197millionbarrelsofoilequivalentforsubsidiariesand1,114millionbarrelsofoilequivalentforequity-accountedentities)associatedwithpropertiescurrently
heldforsalewherethedisposalhasnotyetbeencompleted.
iI
ncludes197millionbarrelsofoilequivalentrelatingtoassetsheldforsaleat31December2010.Amountsbyregionare:34millionbarrelsofoilequivalentinUS;64millionbarrelsofoilequivalentin
SouthAmerica;and99millionbarrelsofoilequivalentinRestofAsia.
jI
ncludes1,114millionbarrelsofoilequivalentrelatingtoassetsheldforsaleat31December2010.
kIncludes6millionbarrelsofoilequivalentsoldrelatingtoproductionsinceclassicationofequity-accountedentitiesasheldforsale.
lIncludes38millionbarrelsofoilequivalent(excludinggasconsumedinoperations)relatingtoproductionfromassetsheldforsaleat31December2010.Amountsbyregionare:6millionbarrelsofoil
equivalentinUS;11millionbarrelsofoilequivalentinSouthAmerica;and21millionbarrelsofoilequivalentinRestofAsia.
Includes59millionbarrelsofoilequivalent(excludinggasconsumedinoperations)relatingtoproductionfromassetsheldforsaleat31December2010.
BPAnnualReportandForm20-F2010 237