BMW 2004 Annual Report Download - page 56
Download and view the complete annual report
Please find page 56 of the 2004 BMW annual report below. You can navigate through the pages in the report by either clicking on the pages listed below, or by using the keyword search tool below to find specific information within the annual report.-
 1
1 -
2
-
3
-
4
-
5
-
6
-
7
-
8
-
9
-
10
-
11
-
12
-
13
-
14
-
15
-
16
-
17
-
18
-
19
-
20
-
21
-
22
-
23
-
24
-
25
-
26
-
27
-
28
-
29
-
30
-
31
-
32
-
33
-
34
-
35
-
36
-
37
-
38
-
39
-
40
-
41
-
42
-
43
-
44
-
45
-
 46
46 -
 47
47 -
 48
48 -
 49
49 -
 50
50 -
 51
51 -
 52
52 -
 53
53 -
 54
54 -
 55
55 -
 56
56 -
 57
57 -
 58
58 -
 59
59 -
 60
60 -
 61
61 -
 62
62 -
 63
63 -
 64
64 -
 65
65 -
 66
66 -
67
-
68
-
69
-
70
-
71
-
72
-
73
-
74
-
75
-
76
-
77
-
78
-
79
-
80
-
81
-
82
-
83
-
84
-
85
-
86
-
87
-
88
-
89
-
90
-
91
-
92
-
93
-
94
-
95
-
96
-
97
-
98
-
99
-
100
-
101
-
102
-
103
-
104
-
105
-
106
-
107
-
108
-
109
-
110
-
111
-
112
-
113
-
114
-
115
-
116
-
117
-
118
-
119
-
120
-
121
-
122
-
123
-
124
-
125
-
126
-
127
-
128
-
129
-
130
-
131
-
132
-
133
-
134
-
135
-
136
-
137
-
138
-
139
-
140
-
141
-
142
-
143
-
144
-
145
-
146
-
147
-
148
-
149
-
150
-
151
-
152
-
153
-
154
-
155
-
156
-
157
-
158
-
159
-
160
-
161
-
162
-
163
-
164
-
165
-
166
-
167
-
168
-
169
-
170
-
171
-
172
-
173
-
174
-
175
-
176
-
177
-
178
-
179
-
180
-
181
-
182
-
183
-
184
-
185
-
186
-
187
-
188
-
189
-
190
-
191
-
192
-
193
-
194
-
195
-
196
-
197
-
198
-
199
-
200
 |
 |

55
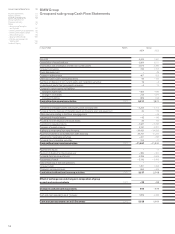
Industrial operations Financial operations
2004 2003 2004 2003
1,981 1,695 449 427 Net profit
562,390 2,146 Depreciation of leased products
2,660 2,369 15 21 Depreciation and amortisation of other non-current assets
653 1,157 98 –Increase in provisions
–49 ––Rover disengagement
482 787 111 167 Change in deferred taxes
63 –59 32 –85 Other non-cash income and expense items
19 –6 –2Gain/loss on disposal of non-current assets and marketable securities
–4 13 ––Undistributed results from associated companies
Changes in current assets and liabilities
– 864 – 651 –1 11 Change in inventories
472 –1,084 – 344 – 662 Change in receivables
690 694 404 874 Increase in liabilities
6,157 4,970 3,154 2,901 Cash inflow from operating activities
– 4,225 – 4,094 –18 –21 Investment in intangible assets and property, plant and equipment
40 114 25
Proceeds from the disposal of intangible assets and property, plant and equipment
––49 ––Other payments relating to the Rover disengagement
–34 –153 –9 –6 Investment in financial assets
31 52 38Proceeds from the disposal of financial assets
– 337 – 283 – 6,990 – 5,502 Investment in leased products
336 240 2,861 2,467 Disposals of leased products
––– 38,432 – 34,593 Additions to receivables from sales financing
––34,741 31,246 Payments received on receivables from sales financing
– 241 – 700 ––Investment in marketable securities
315 27 ––Proceeds from marketable securities
– 4,115 – 4,846 – 7,842 – 6,396 Cash outflow from investing activities
–17 –11 Payment into equity
– 392 – 351 ––Payment of dividend for the previous year
––4,339 5,669 Proceeds from the issue of bonds
––– 3,126 – 3,483 Repayment of bonds
– 1,074 – 425 1,074 425 Internal financing of financial operations
175 116 1,276 1,248 Increase in debt
–– 494 865 46 Change in commercial paper
– 1,291 – 1,137 4,428 3,916 Cash inflow/outflow from financing activities
Effect of exchange rate and changes in composition of group
–1 4–21 –86 on cash and cash equivalents
750 – 1,009 – 281 335 Change in cash and cash equivalents
1,247 2,256 412 77 Cash and cash equivalents as at 1 January
1,997 1,247 131 412 Cash and cash equivalents as at 31 December