BMW 2004 Annual Report Download - page 35
Download and view the complete annual report
Please find page 35 of the 2004 BMW annual report below. You can navigate through the pages in the report by either clicking on the pages listed below, or by using the keyword search tool below to find specific information within the annual report.-
 1
1 -
2
-
3
-
4
-
5
-
6
-
7
-
8
-
9
-
10
-
11
-
12
-
13
-
14
-
15
-
16
-
17
-
18
-
19
-
20
-
21
-
22
-
23
-
24
-
 25
25 -
 26
26 -
 27
27 -
 28
28 -
 29
29 -
 30
30 -
 31
31 -
 32
32 -
 33
33 -
 34
34 -
 35
35 -
 36
36 -
 37
37 -
 38
38 -
 39
39 -
 40
40 -
 41
41 -
 42
42 -
 43
43 -
 44
44 -
 45
45 -
46
-
47
-
48
-
49
-
50
-
51
-
52
-
53
-
54
-
55
-
56
-
57
-
58
-
59
-
60
-
61
-
62
-
63
-
64
-
65
-
66
-
67
-
68
-
69
-
70
-
71
-
72
-
73
-
74
-
75
-
76
-
77
-
78
-
79
-
80
-
81
-
82
-
83
-
84
-
85
-
86
-
87
-
88
-
89
-
90
-
91
-
92
-
93
-
94
-
95
-
96
-
97
-
98
-
99
-
100
-
101
-
102
-
103
-
104
-
105
-
106
-
107
-
108
-
109
-
110
-
111
-
112
-
113
-
114
-
115
-
116
-
117
-
118
-
119
-
120
-
121
-
122
-
123
-
124
-
125
-
126
-
127
-
128
-
129
-
130
-
131
-
132
-
133
-
134
-
135
-
136
-
137
-
138
-
139
-
140
-
141
-
142
-
143
-
144
-
145
-
146
-
147
-
148
-
149
-
150
-
151
-
152
-
153
-
154
-
155
-
156
-
157
-
158
-
159
-
160
-
161
-
162
-
163
-
164
-
165
-
166
-
167
-
168
-
169
-
170
-
171
-
172
-
173
-
174
-
175
-
176
-
177
-
178
-
179
-
180
-
181
-
182
-
183
-
184
-
185
-
186
-
187
-
188
-
189
-
190
-
191
-
192
-
193
-
194
-
195
-
196
-
197
-
198
-
199
-
200
 |
 |
Group Management Report 8
A review of the Financial Year 8
Outlook 29
Financial Analysis 30
--Earnings performance 30
--Financial position 33
--Net assets position 34
--Events after the
Balance Sheet date 37
--Value added statement 37
--Key performance figures 39
--Comments on the financial
statements of BMW AG 40
Risk Management 44
BMW Stock in 2004 48
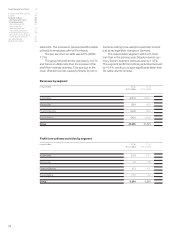
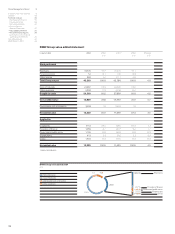
34
Net interest-bearing assets (cash and cash
equivalents and marketable securities less debt) re-
lating to industrial operations increased by euro 547
million to euro 2,363 million.
Net assets position
The balance sheet total of the BMW Group increased
by euro 5,940 million or 9.7% to euro 67,415 million.
The main factors behind this increase on the assets
side of the balance sheet were the increased level of
receivables from sales financing (+14.1%), property,
plant and equipment (+10.5%), leased products
(+12.0%), inventories (+13.6%) and intangible assets
(+17.4%). On the equity and liabilities side of the
balance sheet, the main changes occurred in equity
(+8.5%), debt (+11.1%) and deferred income
(+86.1%). Currency factors, mainly in connection
with the low exchange rate of the US dollar reduced
the balance sheet total by euro1,322 million.Adjusted
for changes in exchange rates, the balance sheet
total would have risen by 12.1%.
Intangible assets increased by 17.4% to euro
3,758 million. Within intangible assets, capitalised
development costs increased by 16.1% to euro
3,495 million. Development costs recognised as
assets during the financial year 2004 amounted to
euro1,121 million (+12.6 %), equivalent to a capitali-
sation ratio of 39.8 % (2003: 38.9%). Depreciation
and disposals amounted to euro 637 million (+9.3%).
The total carrying amount of property, plant and
equipment increased by 10.5% to euro 10,724 mil-
lion. The bulk of capital expenditure related to new
construction for and expansion of production plants.
In total, euro 3,079 million was invested in property,
plant and equipment (–2.3%). Total depreciation
and disposals, including currency impact, amounted
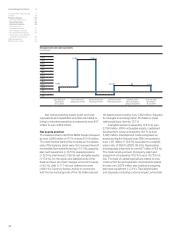
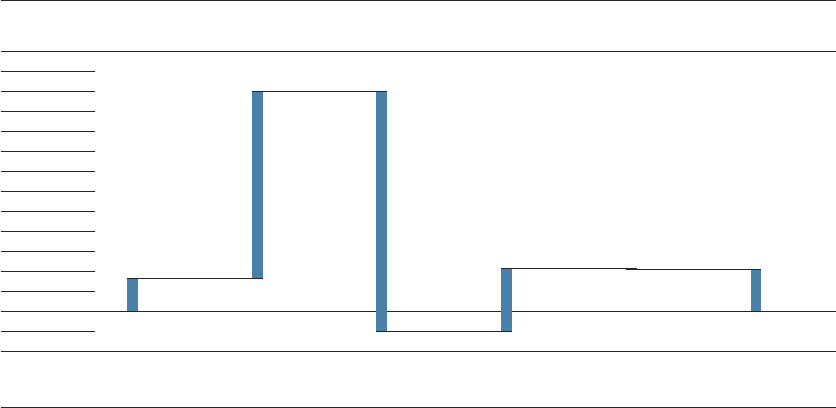
Change in cash and cash equivalents
in euro million
12,000
11,000
10,000
9,000
8,000
7,000
6,000
5,000
4,000
3,000
2,000
1,000
0
–1,000
Cash and cash
equivalents
31.12. 2003
Cash inflow from
operating activities
Cash outflow from
investing activities
Cash inflow from
financing activities
Currency trans-
lation, changes in
group composition
Cash and cash
equivalents
31.12.2004
1,659
+9,311 – 11,957
+3,137 –22 2,128