BMW 2004 Annual Report Download - page 102
Download and view the complete annual report
Please find page 102 of the 2004 BMW annual report below. You can navigate through the pages in the report by either clicking on the pages listed below, or by using the keyword search tool below to find specific information within the annual report.-
 1
1 -
2
-
3
-
4
-
5
-
6
-
7
-
8
-
9
-
10
-
11
-
12
-
13
-
14
-
15
-
16
-
17
-
18
-
19
-
20
-
21
-
22
-
23
-
24
-
25
-
26
-
27
-
28
-
29
-
30
-
31
-
32
-
33
-
34
-
35
-
36
-
37
-
38
-
39
-
40
-
41
-
42
-
43
-
44
-
45
-
46
-
47
-
48
-
49
-
50
-
51
-
52
-
53
-
54
-
55
-
56
-
57
-
58
-
59
-
60
-
61
-
62
-
63
-
64
-
65
-
66
-
67
-
68
-
69
-
70
-
71
-
72
-
73
-
74
-
75
-
76
-
77
-
78
-
79
-
80
-
81
-
82
-
83
-
84
-
85
-
86
-
87
-
88
-
89
-
90
-
91
-
 92
92 -
 93
93 -
 94
94 -
 95
95 -
 96
96 -
 97
97 -
 98
98 -
 99
99 -
 100
100 -
 101
101 -
 102
102 -
 103
103 -
 104
104 -
 105
105 -
 106
106 -
 107
107 -
 108
108 -
 109
109 -
 110
110 -
 111
111 -
 112
112 -
113
-
114
-
115
-
116
-
117
-
118
-
119
-
120
-
121
-
122
-
123
-
124
-
125
-
126
-
127
-
128
-
129
-
130
-
131
-
132
-
133
-
134
-
135
-
136
-
137
-
138
-
139
-
140
-
141
-
142
-
143
-
144
-
145
-
146
-
147
-
148
-
149
-
150
-
151
-
152
-
153
-
154
-
155
-
156
-
157
-
158
-
159
-
160
-
161
-
162
-
163
-
164
-
165
-
166
-
167
-
168
-
169
-
170
-
171
-
172
-
173
-
174
-
175
-
176
-
177
-
178
-
179
-
180
-
181
-
182
-
183
-
184
-
185
-
186
-
187
-
188
-
189
-
190
-
191
-
192
-
193
-
194
-
195
-
196
-
197
-
198
-
199
-
200
 |
 |

101
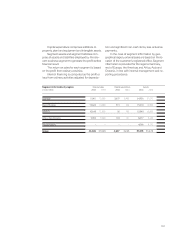
Capital expenditure comprises additions to
property, plant and equipment and intangible assets.
Segment assets and segment liabilities com-
prise all assets and liabilities employed by the rele-
vant business segment to generate the profit before
financial result.
The return on sales for each segment is based
on the profit from ordinary activities.
Internal financing is computed as the profit or
loss from ordinary activities adjusted for deprecia-
tion and significant non-cash items, less actual tax
payments.
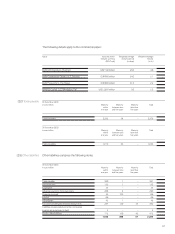
In the case of segment information by geo-
graphical region, external sales are based on the lo-
cation of the customer’s registered office. Segment
information is provided for the regions Germany,
rest of Europe, the Americas and Africa, Asia and
Oceania, in line with internal management and re-
porting procedures.
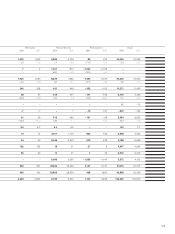
Segment information by region External sales Capital expenditure Assets
in euro million 2004 2003 2004 2003 2004 2003
Germany 11,961 10,590 3,637 3,492 24,905 21,510
Rest of Europe 15,823 13,389 515 549 15,618 14,390
America 10,648 11,620 92 143 15,949 15,263
Africa, Asia, Oceania 5,903 5,926 103 61 6,877 6,142
Reconciliations – –––4,066 4,170
Group 44,335 41,525 4,347 4,245 67,415 61,475