Advance Auto Parts 2012 Annual Report Download - page 85
Download and view the complete annual report
Please find page 85 of the 2012 Advance Auto Parts annual report below. You can navigate through the pages in the report by either clicking on the pages listed below, or by using the keyword search tool below to find specific information within the annual report.-
 1
1 -
2
-
3
-
4
-
5
-
6
-
7
-
8
-
9
-
10
-
11
-
12
-
13
-
14
-
15
-
16
-
17
-
18
-
19
-
20
-
21
-
22
-
23
-
24
-
25
-
26
-
27
-
28
-
29
-
30
-
31
-
32
-
33
-
34
-
35
-
36
-
37
-
38
-
39
-
40
-
41
-
42
-
43
-
44
-
45
-
46
-
47
-
48
-
49
-
50
-
51
-
52
-
53
-
54
-
55
-
56
-
57
-
58
-
59
-
60
-
61
-
62
-
63
-
64
-
65
-
66
-
67
-
68
-
69
-
70
-
71
-
72
-
73
-
74
-
 75
75 -
 76
76 -
 77
77 -
 78
78 -
 79
79 -
 80
80 -
 81
81 -
 82
82 -
 83
83 -
 84
84 -
 85
85 -
 86
86 -
 87
87 -
 88
88 -
 89
89 -
 90
90 -
 91
91 -
 92
92 -
 93
93 -
 94
94 -
 95
95 -
96
-
97
-
98
-
99
-
100
 |
 |

F-40
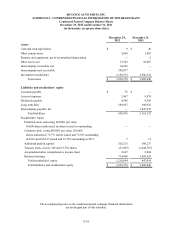
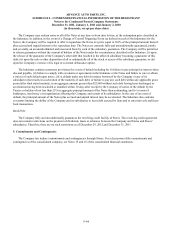
ADVANCE AUTO PARTS, INC.
SCHEDULE I - CONDENSED FINANCIAL INFORMATION OF THE REGISTRANT
Condensed Parent Company Statements of Operations
For the Years Ended December 29, 2012, December 31, 2011 and January 1, 2011
(in thousands, except per share data)
Fiscal Years
2012 2011 2010
Selling, general and administrative expenses $ 18,447 $ 21,603 $ 35,017
Other income, net 19,062 23,046 36,918
Income before provision for income taxes 615 1,443 1,901
Income tax provision 1,048 1,159 1,761
(Loss) income before equity in earnings of subsidiaries (433) 284 140
Equity in earnings of subsidiaries 388,103 394,398 345,913
Net income $ 387,670 $ 394,682 $ 346,053
Basic earnings per share $ 5.29 $ 5.21 $ 4.00
Diluted earnings per share $ 5.22 $ 5.11 $ 3.95
Average common shares outstanding 73,091 75,620 86,082
Average common shares outstanding - assuming dilution 74,062 77,071 87,155
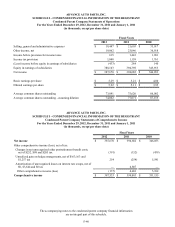
ADVANCE AUTO PARTS, INC.
SCHEDULE I - CONDENSED FINANCIAL INFORMATION OF THE REGISTRANT
Condensed Parent Company Statements of Comprehensive Income
For the Years Ended December 29, 2012, December 31, 2011 and January 1, 2011
(in thousands, except per share data)
Fiscal Years
2012 2011 2010
Net income $ 387,670 $ 394,682 $ 346,053
Other comprehensive income (loss), net of tax:
Changes in net unrecognized other postretirement benefit costs,
net of $252, $98 and $205 tax (391)(152)(439)
Unrealized gain on hedge arrangements, net of $163,163 and
$1,257 tax 254 (254) 5,541
Amortization of unrecognized losses on interest rate swaps, net of
$0, $3,644 and $0 tax — 4,807 —
Other comprehensive income (loss) (137) 4,401 5,102
Comprehensive income $ 387,533 $ 399,083 $ 351,155
The accompanying notes to the condensed parent company financial information
are an integral part of this schedule.