Advance Auto Parts 2012 Annual Report Download - page 34
Download and view the complete annual report
Please find page 34 of the 2012 Advance Auto Parts annual report below. You can navigate through the pages in the report by either clicking on the pages listed below, or by using the keyword search tool below to find specific information within the annual report.-
 1
1 -
2
-
3
-
4
-
5
-
6
-
7
-
8
-
9
-
10
-
11
-
12
-
13
-
14
-
15
-
16
-
17
-
18
-
19
-
20
-
21
-
22
-
23
-
 24
24 -
 25
25 -
 26
26 -
 27
27 -
 28
28 -
 29
29 -
 30
30 -
 31
31 -
 32
32 -
 33
33 -
 34
34 -
 35
35 -
 36
36 -
 37
37 -
 38
38 -
 39
39 -
 40
40 -
 41
41 -
 42
42 -
 43
43 -
 44
44 -
45
-
46
-
47
-
48
-
49
-
50
-
51
-
52
-
53
-
54
-
55
-
56
-
57
-
58
-
59
-
60
-
61
-
62
-
63
-
64
-
65
-
66
-
67
-
68
-
69
-
70
-
71
-
72
-
73
-
74
-
75
-
76
-
77
-
78
-
79
-
80
-
81
-
82
-
83
-
84
-
85
-
86
-
87
-
88
-
89
-
90
-
91
-
92
-
93
-
94
-
95
-
96
-
97
-
98
-
99
-
100
 |
 |

27
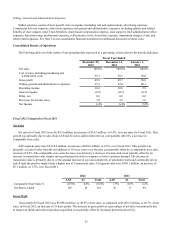
Gross Profit
Gross profit for Fiscal 2011 was $3,069.3 million, or 49.7% of net sales, as compared to $2,961.3 million, or 50.0% of net
sales, in Fiscal 2010, a decrease of 24 basis points. This decrease in gross profit as a percentage of net sales was driven by
increased shrink expense, supply chain deleverage due to investments in HUBs and higher fuel costs and commodity price
inflation partially offset by improved merchandising and pricing capabilities (such as global sourcing and price optimization)
and improved parts availability.
SG&A Expenses
SG&A expenses for Fiscal 2011 were $2,404.6 million, or 39.0% of net sales, as compared to $2,376.4 million, or 40.1%
of net sales, for Fiscal 2010, a decrease of 114 basis points. This decrease as a percentage of net sales was primarily due to
reduced incentive compensation as a result of lower comparable store sales growth compared to the prior year, store labor
leverage resulting from productivity improvements driven by our new variable customer driven labor model, occupancy cost
leverage and a decrease in administrative expenses partially offset by increased strategic investments and advertising. These
investments included spending in the e-commerce and Commercial areas of our business in support of our Superior Availability
and Service Leadership strategies.
Operating Income
Operating income for Fiscal 2011 was $664.6 million, representing 10.8% of net sales, as compared to $584.9 million, or
9.9% of net sales, for Fiscal 2010, an increase of 90 basis points. This increase was due to a lower SG&A rate partially offset
by a slightly lower gross profit rate.
AAP produced operating income of $653.1 million, or 11.1% of net sales, for Fiscal 2011 as compared to $580.4 million,
or 10.2% of net sales, for Fiscal 2010. AI generated operating income for Fiscal 2011 of $11.5 million as compared to $4.5
million for Fiscal 2010. AI's operating income increased during Fiscal 2011 primarily due to the leverage of SG&A as a result
of its improved comparable store sales and decelerated pace of new store openings in Fiscal 2011.
Interest Expense
Interest expense for Fiscal 2011 was $30.9 million, or 0.5% of net sales, as compared to $26.9 million, or 0.5% of net
sales, in Fiscal 2010. The increase in interest expense is primarily a result of the amortization of the previously recorded losses
in accumulated other comprehensive loss over the remaining life of our interest rate swaps and higher average borrowings
outstanding during Fiscal 2011 compared to Fiscal 2010. The interest rate swaps were associated with bank debt which we
repaid near the beginning of our second quarter of Fiscal 2010.
Income Taxes
Income tax expense for Fiscal 2011 was $238.6 million, as compared to $211.0 million for Fiscal 2010. Our effective
income tax rate was 37.7% and 37.9% for Fiscal 2011 and Fiscal 2010, respectively.
Net Income
Net income was $394.7 million, or $5.11 per diluted share, for Fiscal 2011 as compared to $346.1 million, or $3.95 per
diluted share, for Fiscal 2010. As a percentage of net sales, net income for Fiscal 2011 was 6.4%, as compared to 5.8% for
Fiscal 2010. The increase in diluted EPS was primarily driven by an increase in net income and our repurchase of $9.9 million
shares of our common stock in Fiscal 2011.