Advance Auto Parts 2012 Annual Report Download - page 36
Download and view the complete annual report
Please find page 36 of the 2012 Advance Auto Parts annual report below. You can navigate through the pages in the report by either clicking on the pages listed below, or by using the keyword search tool below to find specific information within the annual report.-
 1
1 -
2
-
3
-
4
-
5
-
6
-
7
-
8
-
9
-
10
-
11
-
12
-
13
-
14
-
15
-
16
-
17
-
18
-
19
-
20
-
21
-
22
-
23
-
24
-
25
-
 26
26 -
 27
27 -
 28
28 -
 29
29 -
 30
30 -
 31
31 -
 32
32 -
 33
33 -
 34
34 -
 35
35 -
 36
36 -
 37
37 -
 38
38 -
 39
39 -
 40
40 -
 41
41 -
 42
42 -
 43
43 -
 44
44 -
 45
45 -
 46
46 -
47
-
48
-
49
-
50
-
51
-
52
-
53
-
54
-
55
-
56
-
57
-
58
-
59
-
60
-
61
-
62
-
63
-
64
-
65
-
66
-
67
-
68
-
69
-
70
-
71
-
72
-
73
-
74
-
75
-
76
-
77
-
78
-
79
-
80
-
81
-
82
-
83
-
84
-
85
-
86
-
87
-
88
-
89
-
90
-
91
-
92
-
93
-
94
-
95
-
96
-
97
-
98
-
99
-
100
 |
 |

29
Stock Repurchase Program
Our stock repurchase program allows us to repurchase our common stock on the open market or in privately negotiated
transactions from time to time in accordance with the requirements of the SEC.
During Fiscal 2012, we repurchased 0.3 million shares of our common stock at an aggregate cost of $19.6 million, or an
average price of $76.18 per share. At December 29, 2012, we had $492.4 million remaining under our $500 million stock
repurchase program authorized by our Board of Directors on May 14, 2012. Additionally, during Fiscal 2012, we repurchased
0.1 million shares of our common stock at an aggregate cost of $7.5 million, or an average price of $82.42 per share, in
connection with the net settlement of shares issued as a result of the vesting of restricted stock.
Dividend
Since Fiscal 2006, our Board of Directors has declared quarterly dividends of $0.06 per share to stockholders of record. On
February 5, 2013, our Board of Directors declared a quarterly dividend of $0.06 per share to be paid on April 5, 2013 to all
common stockholders of record as of March 22, 2013.
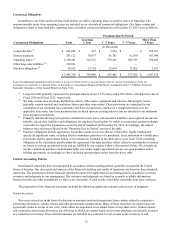
Commercial Credit Program
During Fiscal 2012, we transitioned our commercial credit program from using a third party financial institution to settle
credit transactions with our Commercial customers to processing those transactions internally. Benefits we expect to realize
include a higher level of service with our Commercial customers and having a capability in place to increase the amount of
Commercial sales on credit while realizing cost savings over the long-term.
Our concentration of credit risk with respect to trade receivables is limited because our customer base consists of a large
number of customers with relatively small balances, which allows the credit risk to be spread across a broad base. We also
mitigate our exposure to credit risk through a credit approval process including credit checks, pre-determined credit limits and
accounts receivable and credit monitoring procedures.
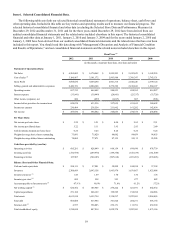
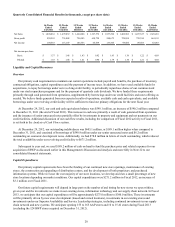
Analysis of Cash Flows
A summary and analysis of our cash flows for Fiscal 2012, 2011 and 2010 is reflected in the table and following
discussion.
Fiscal Year
2012 2011 2010
(in millions)
Cash flows from operating activities $ 685.3 $ 828.8 $ 666.2
Cash flows from investing activities (273.0)(290.0)(199.4)
Cash flows from financing activities 127.9 (540.2)(507.6)
Net increase (decrease) in cash and
cash equivalents $ 540.2 $ (1.3) $ (40.8)
Operating Activities
For Fiscal 2012, net cash provided by operating activities decreased $143.6 million to $685.3 million. This net decrease in
operating cash flow was primarily due to:
• a $74.1 million decrease in cash flows from receivables primarily related to the transition of our in-house commercial
credit program;
• a $65.1 million decrease in cash flows from inventory, net of accounts payable, due to a 13% increase in inventory
over the prior year driven by our inventory availability initiatives, including store upgrades to a greater coverage of
parts, the opening of our new distribution center, continued expansion of our HUB network and new store growth,
coupled with a smaller increase in our accounts payable ratio versus the prior year;
• a $26.1 million decrease in provision for deferred income taxes due to the lapse of certain corporate tax legislation;
• a $14.9 million decrease in cash flow from other assets primarily related to timing of refundable income taxes and
other working capital;
• a $13.4 million decrease in cash flow from the excess tax benefit from share-based compensation; and
• a $7.0 million decrease in net income.