Advance Auto Parts 2012 Annual Report Download - page 82
Download and view the complete annual report
Please find page 82 of the 2012 Advance Auto Parts annual report below. You can navigate through the pages in the report by either clicking on the pages listed below, or by using the keyword search tool below to find specific information within the annual report.-
 1
1 -
2
-
3
-
4
-
5
-
6
-
7
-
8
-
9
-
10
-
11
-
12
-
13
-
14
-
15
-
16
-
17
-
18
-
19
-
20
-
21
-
22
-
23
-
24
-
25
-
26
-
27
-
28
-
29
-
30
-
31
-
32
-
33
-
34
-
35
-
36
-
37
-
38
-
39
-
40
-
41
-
42
-
43
-
44
-
45
-
46
-
47
-
48
-
49
-
50
-
51
-
52
-
53
-
54
-
55
-
56
-
57
-
58
-
59
-
60
-
61
-
62
-
63
-
64
-
65
-
66
-
67
-
68
-
69
-
70
-
71
-
 72
72 -
 73
73 -
 74
74 -
 75
75 -
 76
76 -
 77
77 -
 78
78 -
 79
79 -
 80
80 -
 81
81 -
 82
82 -
 83
83 -
 84
84 -
 85
85 -
 86
86 -
 87
87 -
 88
88 -
 89
89 -
 90
90 -
 91
91 -
 92
92 -
93
-
94
-
95
-
96
-
97
-
98
-
99
-
100
 |
 |

F-37
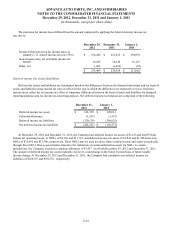
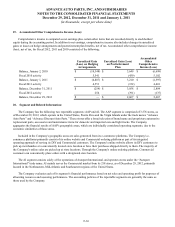
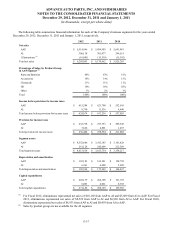
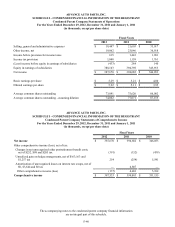
The following table summarizes financial information for each of the Company's business segments for the years ended
December 29, 2012, December 31, 2011 and January 1, 2011, respectively.
2012 2011 2010
Net sales
AAP $ 5,914,946 $ 5,884,903 $ 5,691,081
AI 306,138 301,077 249,514
Eliminations (1) (16,081) (15,518) (15,392)
Total net sales $ 6,205,003 $ 6,170,462 $ 5,925,203
Percentage of Sales, by Product Group
in AAP Segment (2)
Parts and Batteries 64% 63% 61%
Accessories 14% 14% 15%
Chemicals 11% 11% 11%
Oil 10% 10% 10%
Other 1% 2% 3%
Total 100% 100% 100%
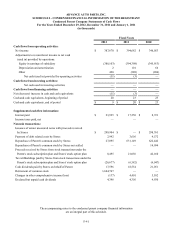
Income before provision for income taxes
AAP $ 615,284 $ 621,700 $ 552,565
AI 8,790 11,536 4,490
Total income before provision for income taxes $ 624,074 $ 633,236 $ 557,055
Provision for income taxes
AAP $ 232,778 $ 233,753 $ 209,545
AI 3,626 4,801 1,457
Total provision for income taxes $ 236,404 $ 238,554 $ 211,002
Segment assets
AAP $ 4,352,686 $ 3,413,145 $ 3,141,828
AI 261,128 242,609 212,389
Total segment assets $ 4,613,814 $ 3,655,754 $ 3,354,217
Depreciation and amortization
AAP $ 183,183 $ 169,541 $ 158,738
AI 6,361 6,408 5,699
Total depreciation and amortization $ 189,544 $ 175,949 $ 164,437
Capital expenditures
AAP $ 265,179 $ 264,108 $ 191,193
AI 6,003 4,021 8,392
Total capital expenditures $ 271,182 $ 268,129 $ 199,585
(1) For Fiscal 2012, eliminations represented net sales of $10,192 from AAP to AI and $5,889 from AI to AAP. For Fiscal
2011, eliminations represented net sales of $8,522 from AAP to AI and $6,996 from AI to AAP. For Fiscal 2010,
eliminations represented net sales of $6,933 from AAP to AI and $8,459 from AI to AAP.
(2) Sales by product group are not available for the AI segment.
ADVANCE AUTO PARTS, INC. AND SUBSIDIARIES
NOTES TO THE CONSOLIDATED FINANCIAL STATEMENTS
December 29, 2012, December 31, 2011 and January 1, 2011
(in thousands, except per share data)