Advance Auto Parts 2012 Annual Report Download - page 12
Download and view the complete annual report
Please find page 12 of the 2012 Advance Auto Parts annual report below. You can navigate through the pages in the report by either clicking on the pages listed below, or by using the keyword search tool below to find specific information within the annual report.-
 1
1 -
 2
2 -
 3
3 -
 4
4 -
 5
5 -
 6
6 -
 7
7 -
 8
8 -
 9
9 -
 10
10 -
 11
11 -
 12
12 -
 13
13 -
 14
14 -
 15
15 -
 16
16 -
 17
17 -
 18
18 -
 19
19 -
 20
20 -
 21
21 -
 22
22 -
23
-
24
-
25
-
26
-
27
-
28
-
29
-
30
-
31
-
32
-
33
-
34
-
35
-
36
-
37
-
38
-
39
-
40
-
41
-
42
-
43
-
44
-
45
-
46
-
47
-
48
-
49
-
50
-
51
-
52
-
53
-
54
-
55
-
56
-
57
-
58
-
59
-
60
-
61
-
62
-
63
-
64
-
65
-
66
-
67
-
68
-
69
-
70
-
71
-
72
-
73
-
74
-
75
-
76
-
77
-
78
-
79
-
80
-
81
-
82
-
83
-
84
-
85
-
86
-
87
-
88
-
89
-
90
-
91
-
92
-
93
-
94
-
95
-
96
-
97
-
98
-
99
-
100
 |
 |
5
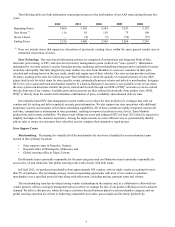
The following table sets forth information concerning increases in the total number of our AAP stores during the past five
years:
2012 2011 2010 2009 2008
Beginning Stores 3,460 3,369 3,264 3,243 3,153
New Stores (1) 116 95 110 75 109
Stores Closed — (4)(5)(54)(19)
Ending Stores 3,576 3,460 3,369 3,264 3,243
(1) Does not include stores that opened as relocations of previously existing stores within the same general market area or
substantial renovations of stores.
Store Technology. Our store-based information systems are comprised of a proprietary and integrated Point of Sale,
electronic parts catalog, or EPC, and store-level inventory management system (collectively "store system"). Information
maintained by our store system is used to formulate pricing, marketing and merchandising strategies and to replenish inventory
accurately and rapidly. Our fully integrated system enables our store Team Members to assist our customers in their parts
selection and ordering based on the year, make, model and engine type of their vehicles. Our store system provides real-time
inventory tracking at the store level allowing store Team Members to check the quantity of on-hand inventory for any SKU,
adjust stock levels for select items for store specific events, automatically process returns and defective merchandise, designate
SKUs for cycle counts and track merchandise transfers. If a hard-to-find part or accessory is not available at one of our stores,
the store system can determine whether the part is carried and in-stock through our HUB or PDQ® networks or can be ordered
directly from one of our vendors. Available parts and accessories are then ordered electronically from another store, HUB,
PDQ® or directly from the vendor with immediate confirmation of price, availability and estimated delivery time.
Our centrally-based EPC data management system enables us to reduce the time needed to (i) exchange data with our
vendors and (ii) catalog and deliver updated, accurate parts information. We also support our store operations with additional
proprietary systems and customer driven labor scheduling capabilities. All of these systems are tightly integrated and provide
real-time, comprehensive information to store personnel, resulting in improved customer service levels, Team Member
productivity and in-stock availability. We plan to start rolling out a new and enhanced EPC in Fiscal 2013 which is expected to
simplify and improve the customer experience. Among the improvements is a more efficient way to systematically identify
add-on sales to ensure our customers have what they need to complete their automotive repair project.
Store Support Center
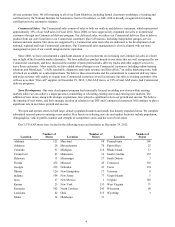
Merchandising. Purchasing for virtually all of the merchandise for our stores is handled by our merchandise teams
located in three primary locations:
• Store support center in Roanoke, Virginia;
• Regional office in Minneapolis, Minnesota; and
• Global sourcing office in Taipei, Taiwan.
Our Roanoke team is primarily responsible for the parts categories and our Minnesota team is primarily responsible for
accessories, oil and chemicals. Our global sourcing team works closely with both teams.
In Fiscal 2012, we purchased merchandise from approximately 450 vendors, with no single vendor accounting for more
than 9% of purchases. Our purchasing strategy involves negotiating agreements with most of our vendors to purchase
merchandise over a specified period of time along with other terms, including pricing, payment terms and volume.
The merchandising team has developed strong vendor relationships in the industry and, in a collaborative effort with our
vendor partners, utilizes a category management process where we manage the mix of our product offerings to meet customer
demand. We believe this process, which develops a customer-focused business plan for each merchandise category, and our
global sourcing operation are critical to improving comparable store sales, gross margin and inventory productivity.