Advance Auto Parts 2012 Annual Report Download - page 31
Download and view the complete annual report
Please find page 31 of the 2012 Advance Auto Parts annual report below. You can navigate through the pages in the report by either clicking on the pages listed below, or by using the keyword search tool below to find specific information within the annual report.-
 1
1 -
2
-
3
-
4
-
5
-
6
-
7
-
8
-
9
-
10
-
11
-
12
-
13
-
14
-
15
-
16
-
17
-
18
-
19
-
20
-
 21
21 -
 22
22 -
 23
23 -
 24
24 -
 25
25 -
 26
26 -
 27
27 -
 28
28 -
 29
29 -
 30
30 -
 31
31 -
 32
32 -
 33
33 -
 34
34 -
 35
35 -
 36
36 -
 37
37 -
 38
38 -
 39
39 -
 40
40 -
 41
41 -
42
-
43
-
44
-
45
-
46
-
47
-
48
-
49
-
50
-
51
-
52
-
53
-
54
-
55
-
56
-
57
-
58
-
59
-
60
-
61
-
62
-
63
-
64
-
65
-
66
-
67
-
68
-
69
-
70
-
71
-
72
-
73
-
74
-
75
-
76
-
77
-
78
-
79
-
80
-
81
-
82
-
83
-
84
-
85
-
86
-
87
-
88
-
89
-
90
-
91
-
92
-
93
-
94
-
95
-
96
-
97
-
98
-
99
-
100
 |
 |

24
miles driven are outside of the manufacturer warranty period. These out-of-warranty, older vehicles generate a stronger demand
for automotive aftermarket products due to routine maintenance cycles and more frequent mechanical failures. We believe that
consumers will continue to keep their vehicles even longer as the economy slowly recovers contributing to the trend of an
aging vehicle population.
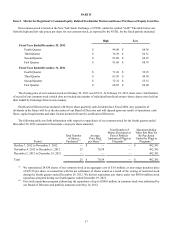
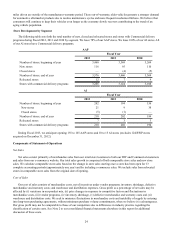
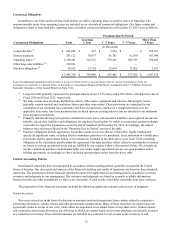
Store Development by Segment
The following table sets forth the total number of new, closed and relocated stores and stores with Commercial delivery
programs during Fiscal 2012, 2011 and 2010 by segment. We lease 78% of our AAP stores. We lease 100% of our AI stores. All
of our AI stores have Commercial delivery programs.
AAP
Fiscal Year
2012 2011 2010
Number of stores, beginning of year 3,460 3,369 3,264
New stores 116 95 110
Closed stores — (4)(5)
Number of stores, end of year 3,576 3,460 3,369
Relocated stores 12 7 9
Stores with commercial delivery programs 3,266 3,124 3,018
AI
Fiscal Year
2012 2011 2010
Number of stores, beginning of year 202 194 156
New stores 21 9 38
Closed stores (5)(1) —
Number of stores, end of year 218 202 194
Relocated stores 7 3 3
Stores with commercial delivery programs 218 202 194
During Fiscal 2013, we anticipate opening 155 to 165 AAP stores and 10 to 15 AI stores (excludes 124 BWP stores
acquired on December 31, 2012).
Components of Statement of Operations
Net Sales
Net sales consist primarily of merchandise sales from our retail store locations to both our DIY and Commercial customers
and sales from our e-commerce website. Our total sales growth is comprised of both comparable store sales and new store
sales. We calculate comparable store sales based on the change in store sales starting once a store has been open for 13
complete accounting periods (approximately one year) and by including e-commerce sales. We include sales from relocated
stores in comparable store sales from the original date of opening.
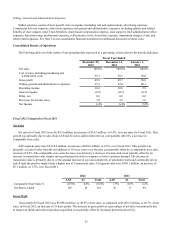
Cost of Sales
Our cost of sales consists of merchandise costs, net of incentives under vendor programs; inventory shrinkage, defective
merchandise and warranty costs; and warehouse and distribution expenses. Gross profit as a percentage of net sales may be
affected by (i) variations in our product mix, (ii) price changes in response to competitive factors and fluctuations in
merchandise costs, (iii) vendor programs, (iv) inventory shrinkage, (v) defective merchandise and warranty costs and (vi)
warehouse and distribution costs. We seek to minimize fluctuations in merchandise costs and instability of supply by entering
into long-term purchasing agreements, without minimum purchase volume commitments, when we believe it is advantageous.
Our gross profit may not be comparable to those of our competitors due to differences in industry practice regarding the
classification of certain costs. See Note 2 to our consolidated financial statements elsewhere in this report for additional
discussion of these costs.