Advance Auto Parts 2012 Annual Report Download - page 52
Download and view the complete annual report
Please find page 52 of the 2012 Advance Auto Parts annual report below. You can navigate through the pages in the report by either clicking on the pages listed below, or by using the keyword search tool below to find specific information within the annual report.-
 1
1 -
2
-
3
-
4
-
5
-
6
-
7
-
8
-
9
-
10
-
11
-
12
-
13
-
14
-
15
-
16
-
17
-
18
-
19
-
20
-
21
-
22
-
23
-
24
-
25
-
26
-
27
-
28
-
29
-
30
-
31
-
32
-
33
-
34
-
35
-
36
-
37
-
38
-
39
-
40
-
41
-
 42
42 -
 43
43 -
 44
44 -
 45
45 -
 46
46 -
 47
47 -
 48
48 -
 49
49 -
 50
50 -
 51
51 -
 52
52 -
 53
53 -
 54
54 -
 55
55 -
 56
56 -
 57
57 -
 58
58 -
 59
59 -
 60
60 -
 61
61 -
 62
62 -
63
-
64
-
65
-
66
-
67
-
68
-
69
-
70
-
71
-
72
-
73
-
74
-
75
-
76
-
77
-
78
-
79
-
80
-
81
-
82
-
83
-
84
-
85
-
86
-
87
-
88
-
89
-
90
-
91
-
92
-
93
-
94
-
95
-
96
-
97
-
98
-
99
-
100
 |
 |

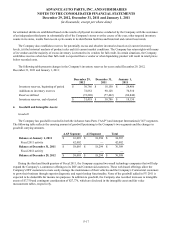
F-7
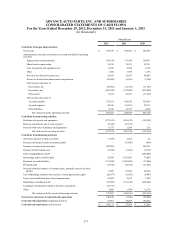
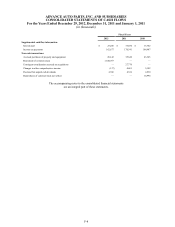
ADVANCE AUTO PARTS, INC. AND SUBSIDIARIES
CONSOLIDATED STATEMENTS OF CASH FLOWS
For the Years Ended December 29, 2012, December 31, 2011 and January 1, 2011
(in thousands)
Fiscal Years
2012 2011 2010
Cash flows from operating activities:
Net income $ 387,670 $ 394,682 $ 346,053
Adjustments to reconcile net income to net cash provided by operating
activities:
Depreciation and amortization 189,544 175,949 164,437
Share-based compensation 15,236 19,553 22,311
Loss on property and equipment, net 2,699 5,228 6,534
Other 1,582 1,098 1,106
Provision for deferred income taxes 26,893 53,037 40,503
Excess tax benefit from share-based compensation (23,099) (9,663) (7,260)
Net (increase) decrease in:
Receivables, net (89,482) (15,372) (31,667)
Inventories, net (260,298) (179,288) (232,003)
Other assets 8,213 23,073 (13,105)
Net increase (decrease) in:
Accounts payable 376,631 360,678 325,839
Accrued expenses 40,936 (15,901) 38,715
Other liabilities 8,756 15,775 4,696
Net cash provided by operating activities 685,281 828,849 666,159
Cash flows from investing activities:
Purchases of property and equipment (271,182) (268,129) (199,585)
Business acquisitions, net of cash acquired (8,369) (23,133) —
Proceeds from sales of property and equipment 6,573 1,288 235
Net cash used in investing activities (272,978) (289,974) (199,350)
Cash flows from financing activities:
(Decrease) increase in bank overdrafts (7,459) 6,625 28
Decrease in financed vendor accounts payable — (31,648) (444)
Issuance of senior unsecured notes 299,904 — 298,761
Payment of debt related costs (2,942) (3,656) (4,572)
Early extinguishment of debt — — (200,000)
Borrowings under credit facilities 58,500 1,435,200 75,000
Payments on credit facilities (173,500) (1,320,200) (75,000)
Dividends paid (17,596) (18,554) (21,051)
Proceeds from the issuance of common stock, primarily exercise of stock
options 8,495 21,056 42,160
Tax withholdings related to the exercise of stock appreciation rights (26,677) (6,582) (6,047)
Excess tax benefit from share-based compensation 23,099 9,663 7,260
Repurchase of common stock (27,095) (631,149) (622,442)
Contingent consideration related to business acquisitions (10,911) — —
Other 4,089 (938) (1,271)
Net cash provided by (used in) financing activities 127,907 (540,183) (507,618)
Net increase (decrease) in cash and cash equivalents 540,210 (1,308) (40,809)
Cash and cash equivalents, beginning of period 57,901 59,209 100,018
Cash and cash equivalents, end of period $ 598,111 $ 57,901 $ 59,209