Advance Auto Parts 2012 Annual Report Download - page 11
Download and view the complete annual report
Please find page 11 of the 2012 Advance Auto Parts annual report below. You can navigate through the pages in the report by either clicking on the pages listed below, or by using the keyword search tool below to find specific information within the annual report.-
 1
1 -
 2
2 -
 3
3 -
 4
4 -
 5
5 -
 6
6 -
 7
7 -
 8
8 -
 9
9 -
 10
10 -
 11
11 -
 12
12 -
 13
13 -
 14
14 -
 15
15 -
 16
16 -
 17
17 -
 18
18 -
 19
19 -
 20
20 -
 21
21 -
 22
22 -
23
-
24
-
25
-
26
-
27
-
28
-
29
-
30
-
31
-
32
-
33
-
34
-
35
-
36
-
37
-
38
-
39
-
40
-
41
-
42
-
43
-
44
-
45
-
46
-
47
-
48
-
49
-
50
-
51
-
52
-
53
-
54
-
55
-
56
-
57
-
58
-
59
-
60
-
61
-
62
-
63
-
64
-
65
-
66
-
67
-
68
-
69
-
70
-
71
-
72
-
73
-
74
-
75
-
76
-
77
-
78
-
79
-
80
-
81
-
82
-
83
-
84
-
85
-
86
-
87
-
88
-
89
-
90
-
91
-
92
-
93
-
94
-
95
-
96
-
97
-
98
-
99
-
100
 |
 |

4
diverse customer base. We offer training to all of our Team Members, including formal classroom workshops, e-learning and
certification by the National Institute for Automotive Service Excellence, or ASE. ASE is broadly recognized for training
certification in the automotive industry.
Commercial Sales. Our Commercial sales consist of sales to both our walk-in and delivery customers, which represented
approximately 35% of our AAP sales in Fiscal 2012. Since 2000, we have aggressively expanded our sales to Commercial
customers through our Commercial delivery program. For delivered sales, we utilize our Commercial delivery fleet to deliver
product from our store locations to our Commercial customers' place of business, including independent garages, service
stations and auto dealers. Our stores are supported by a Commercial sales team who are dedicated to the development of our
national, regional and local Commercial customers. Our Commercial sales management is closely aligned with our store
management as part of our overall integrated store operation.
Since 2008, we have concentrated a significant amount of our investments on increasing our Commercial sales at a faster
rate in light of the favorable market dynamics. We have added key product brands in our stores that are well recognized by our
Commercial customers, and have increased the number of parts professionals, delivery trucks and other support services to
serve those customers. Most recently, we have added other offerings to our Commercial customers, including online training
solutions and MotoLogic,® a fully searchable, diagnostic and repair resource and DriverSide,® an online marketing suite, both
of which are available on a subscription basis. We believe these investments and the commitment to consistent delivery times
and order accuracy will enable us to gain more Commercial customers as well as increase our sales to existing customers who
will use us as their “first call” supplier. At December 29, 2012, 3,266 AAP stores, or 91% of total AAP stores, had Commercial
delivery programs.
Store Development. Our store development program has historically focused on adding new stores within existing
markets where we can achieve a larger presence, remodeling or relocating existing stores and entering new markets. The
addition of new stores, along with strategic acquisitions, have played a significant role in our growth and success. We believe
the opening of new stores, and their strategic location in relation to our DIY and Commercial customers, will continue to play a
significant role in our future growth and success.
We open and operate stores in both large, densely populated markets and small, less densely populated areas. We complete
substantial research prior to entering a new market. Key factors in selecting new site and market locations include population,
demographics, vehicle profile, number and strength of competitors' stores and the cost of real estate.
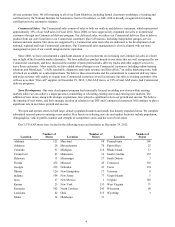
Our 3,576 AAP stores were located in the following states and territories at December 29, 2012:
Location
Number of
Stores Location
Number of
Stores Location
Number of
Stores
Alabama 121 Maryland 88 Pennsylvania 186
Arkansas 28 Massachusetts 70 Puerto Rico 25
Colorado 51 Michigan 114 Rhode Island 13
Connecticut 43 Minnesota 16 South Carolina 132
Delaware 11 Mississippi 57 South Dakota 7
Florida 472 Missouri 45 Tennessee 138
Georgia 239 Nebraska 23 Texas 174
Illinois 120 New Hampshire 17 Vermont 8
Indiana 108 New Jersey 77 Virgin Islands 1
Iowa 27 New Mexico 1 Virginia 185
Kansas 25 New York 151 West Virginia 71
Kentucky 102 North Carolina 245 Wisconsin 60
Louisiana 62 Ohio 215 Wyoming 3
Maine 14 Oklahoma 31