Advance Auto Parts 2012 Annual Report Download - page 26
Download and view the complete annual report
Please find page 26 of the 2012 Advance Auto Parts annual report below. You can navigate through the pages in the report by either clicking on the pages listed below, or by using the keyword search tool below to find specific information within the annual report.-
 1
1 -
2
-
3
-
4
-
5
-
6
-
7
-
8
-
9
-
10
-
11
-
12
-
13
-
14
-
15
-
 16
16 -
 17
17 -
 18
18 -
 19
19 -
 20
20 -
 21
21 -
 22
22 -
 23
23 -
 24
24 -
 25
25 -
 26
26 -
 27
27 -
 28
28 -
 29
29 -
 30
30 -
 31
31 -
 32
32 -
 33
33 -
 34
34 -
 35
35 -
 36
36 -
37
-
38
-
39
-
40
-
41
-
42
-
43
-
44
-
45
-
46
-
47
-
48
-
49
-
50
-
51
-
52
-
53
-
54
-
55
-
56
-
57
-
58
-
59
-
60
-
61
-
62
-
63
-
64
-
65
-
66
-
67
-
68
-
69
-
70
-
71
-
72
-
73
-
74
-
75
-
76
-
77
-
78
-
79
-
80
-
81
-
82
-
83
-
84
-
85
-
86
-
87
-
88
-
89
-
90
-
91
-
92
-
93
-
94
-
95
-
96
-
97
-
98
-
99
-
100
 |
 |

19
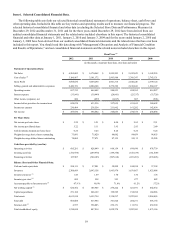
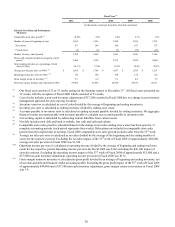
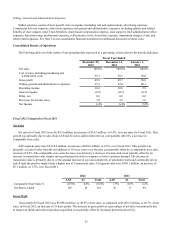
Item 6. Selected Consolidated Financial Data.
The following table sets forth our selected historical consolidated statement of operations, balance sheet, cash flows and
other operating data. Included in this table are key metrics and operating results used to measure our financial progress. The
selected historical consolidated financial and other data (excluding the Selected Store Data and Performance Measures) at
December 29, 2012 and December 31, 2011 and for the three years ended December 29, 2012 have been derived from our
audited consolidated financial statements and the related notes included elsewhere in this report. The historical consolidated
financial and other data at January 1, 2011, January 2, 2010 and January 3, 2009 and for the years ended January 2, 2010 and
January 3, 2009 have been derived from our audited consolidated financial statements and the related notes that have not been
included in this report. You should read this data along with "Management's Discussion and Analysis of Financial Condition
and Results of Operations," and our consolidated financial statements and the related notes included elsewhere in this report.
Fiscal Year (1)
2012 2011 2010 2009 2008
(in thousands, except per share data, store data and ratios)
Statement of Operations Data:
Net Sales $ 6,205,003 $ 6,170,462 $ 5,925,203 $ 5,412,623 $ 5,142,255
Cost of sales (2) 3,106,967 3,101,172 2,963,888 2,768,397 2,743,131
Gross Profit 3,098,036 3,069,290 2,961,315 2,644,226 2,399,124
Selling, general and administrative expenses 2,440,721 2,404,648 2,376,382 2,189,841 1,984,197
Operating income 657,315 664,642 584,933 454,385 414,927
Interest expense (33,841) (30,949) (26,861) (23,337) (33,729)
Other income (expense), net 600 (457) (1,017) 607 (506)
Income before provision for income taxes 624,074 633,236 557,055 431,655 380,692
Income tax expense 236,404 238,554 211,002 161,282 142,654
Net income $ 387,670 $ 394,682 $ 346,053 $ 270,373 $ 238,038
Per Share Data:
Net income per basic share $ 5.29 $ 5.21 $ 4.00 $ 2.85 $ 2.51
Net income per diluted share 5.22 5.11 3.95 2.83 2.49
Cash dividends declared per basic share 0.24 0.24 0.24 0.24 0.24
Weighted average basic shares outstanding 73,091 75,620 86,082 94,459 94,655
Weighted average diluted shares outstanding 74,062 77,071 87,155 95,113 95,205
Cash flows provided by (used in):
Operating activities $ 685,281 $ 828,849 $ 666,159 $ 699,690 $ 478,739
Investing activities (272,978) (289,974) (199,350) (185,539) (181,609)
Financing activities 127,907 (540,183) (507,618) (451,491) (274,426)
Balance Sheet and Other Financial Data:
Cash and cash equivalents $ 598,111 $ 57,901 $ 59,209 $ 100,018 $ 37,358
Inventory 2,308,609 2,043,158 1,863,870 1,631,867 1,623,088
Inventory turnover (3) 1.43 1.59 1.70 1.70 1.74
Inventory per store (4) 609 558 523 477 482
Accounts payable to Inventory ratio (5) 87.9 % 80.9% 71.0% 61.2% 57.2%
Net working capital (6) $ 624,562 $ 105,945 $ 276,222 $ 421,591 $ 442,632
Capital expenditures 271,182 268,129 199,585 192,934 184,986
Total assets 4,613,814 3,655,754 3,354,217 3,072,963 2,964,065
Total debt 605,088 415,984 301,824 204,271 456,164
Total net debt (7) 6,977 358,083 252,171 113,781 439,394
Total stockholders' equity 1,210,694 847,914 1,039,374 1,282,365 1,075,166