Advance Auto Parts 2012 Annual Report Download - page 33
Download and view the complete annual report
Please find page 33 of the 2012 Advance Auto Parts annual report below. You can navigate through the pages in the report by either clicking on the pages listed below, or by using the keyword search tool below to find specific information within the annual report.-
 1
1 -
2
-
3
-
4
-
5
-
6
-
7
-
8
-
9
-
10
-
11
-
12
-
13
-
14
-
15
-
16
-
17
-
18
-
19
-
20
-
21
-
22
-
 23
23 -
 24
24 -
 25
25 -
 26
26 -
 27
27 -
 28
28 -
 29
29 -
 30
30 -
 31
31 -
 32
32 -
 33
33 -
 34
34 -
 35
35 -
 36
36 -
 37
37 -
 38
38 -
 39
39 -
 40
40 -
 41
41 -
 42
42 -
 43
43 -
44
-
45
-
46
-
47
-
48
-
49
-
50
-
51
-
52
-
53
-
54
-
55
-
56
-
57
-
58
-
59
-
60
-
61
-
62
-
63
-
64
-
65
-
66
-
67
-
68
-
69
-
70
-
71
-
72
-
73
-
74
-
75
-
76
-
77
-
78
-
79
-
80
-
81
-
82
-
83
-
84
-
85
-
86
-
87
-
88
-
89
-
90
-
91
-
92
-
93
-
94
-
95
-
96
-
97
-
98
-
99
-
100
 |
 |

26
SG&A Expenses
SG&A expenses for Fiscal 2012 were $2,440.7 million, or 39.3% of net sales, as compared to $2,404.6 million, or 39.0%
of net sales, for Fiscal 2011, an increase of 36 basis points. This increase as a percentage of net sales was primarily due to
expense deleverage as a result of the Company's lower sales volume and increased new store openings in the second half of
Fiscal 2012, partially offset by lower incentive compensation.
Operating Income
Operating income for Fiscal 2012 was $657.3 million, representing 10.6% of net sales, as compared to $664.6 million, or
10.8% of net sales, for Fiscal 2011, a decrease of 18 basis points. This decrease was due to a higher SG&A rate partially offset
by a slightly higher gross profit rate.
AAP generated operating income of $648.5 million, or 11.0% of net sales, for Fiscal 2012 as compared to $653.1 million,
or 11.1% of net sales, for Fiscal 2011. AI generated operating income for Fiscal 2012 of $8.8 million as compared to $11.5
million for Fiscal 2011. The decrease in AI's operating income was primarily due to increased promotional activity and
increased percentage of newer stores outside of the Northeastern market which operate at a lower gross profit rate, partially
offset by lower incentive compensation.
Interest Expense
Interest expense for Fiscal 2012 was $33.8 million, or 0.5% of net sales, as compared to $30.9 million, or 0.5% of net
sales, in Fiscal 2011. The increase in interest expense is primarily a result of the higher average borrowings outstanding during
Fiscal 2012 compared to Fiscal 2011.
Income Taxes
Income tax expense for Fiscal 2012 was $236.4 million, as compared to $238.6 million for Fiscal 2011. Our effective
income tax rate was 37.9% and 37.7% for Fiscal 2012 and Fiscal 2011, respectively.
Net Income
Net income was $387.7 million, or $5.22 per diluted share, for Fiscal 2012 as compared to $394.7 million, or $5.11 per
diluted share, for Fiscal 2011. As a percentage of net sales, net income for Fiscal 2012 was 6.2%, as compared to 6.4% for
Fiscal 2011. The increase in diluted EPS was driven primarily by a lower average share count outstanding during Fiscal 2012
partially offset by a slight decrease in net income.
Fiscal 2011 Compared to Fiscal 2010
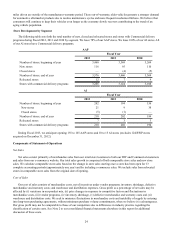
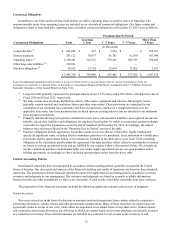
Net Sales
Net sales for Fiscal 2011 were $6,170.5 million, an increase of $245.3 million, or 4.1%, over net sales for Fiscal 2010. This
growth was primarily due to an increase in comparable store sales and sales from AAP and AI stores added within the last year.
AAP produced sales of $5,884.9 million, an increase of $193.8 million, or 3.4%, over Fiscal 2010. The AAP comparable
store sales increase of 1.9% was driven by an increase in average sales per customer. AI produced sales of $301.1 million, an
increase of $51.6 million, or 20.7%, over Fiscal 2010.
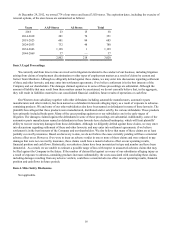
2011 2010
AAP AI Total AAP AI Total
Comparable Store Sales % 1.9% 8.6% 2.2% 8.1% 7.0% 8.0%
Net Stores Added 91 8 99 105 38 143