Advance Auto Parts 2012 Annual Report Download - page 28
Download and view the complete annual report
Please find page 28 of the 2012 Advance Auto Parts annual report below. You can navigate through the pages in the report by either clicking on the pages listed below, or by using the keyword search tool below to find specific information within the annual report.-
 1
1 -
2
-
3
-
4
-
5
-
6
-
7
-
8
-
9
-
10
-
11
-
12
-
13
-
14
-
15
-
16
-
17
-
 18
18 -
 19
19 -
 20
20 -
 21
21 -
 22
22 -
 23
23 -
 24
24 -
 25
25 -
 26
26 -
 27
27 -
 28
28 -
 29
29 -
 30
30 -
 31
31 -
 32
32 -
 33
33 -
 34
34 -
 35
35 -
 36
36 -
 37
37 -
 38
38 -
39
-
40
-
41
-
42
-
43
-
44
-
45
-
46
-
47
-
48
-
49
-
50
-
51
-
52
-
53
-
54
-
55
-
56
-
57
-
58
-
59
-
60
-
61
-
62
-
63
-
64
-
65
-
66
-
67
-
68
-
69
-
70
-
71
-
72
-
73
-
74
-
75
-
76
-
77
-
78
-
79
-
80
-
81
-
82
-
83
-
84
-
85
-
86
-
87
-
88
-
89
-
90
-
91
-
92
-
93
-
94
-
95
-
96
-
97
-
98
-
99
-
100
 |
 |
21
Item 7. Management's Discussion and Analysis of Financial Condition and Results of Operations.
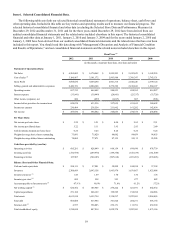
The following discussion and analysis of financial condition and results of operations should be read in conjunction with
"Selected Consolidated Financial Data," our consolidated historical financial statements and the notes to those statements that
appear elsewhere in this report. Our discussion contains forward-looking statements based upon current expectations that
involve risks and uncertainties, such as our plans, objectives, expectations and intentions. Actual results and the timing of
events could differ materially from those anticipated in these forward-looking statements as a result of a number of factors,
including those set forth under the sections entitled “Forward-Looking Statements” and "Risk Factors" elsewhere in this
report.
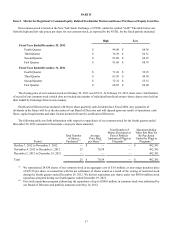
Our fiscal year ends on the Saturday nearest December 31st of each year, which results in an extra week every several
years (the next 53 week fiscal year is 2014). Our first quarter consists of 16 weeks, and the other three quarters consist of 12
weeks.
Introduction
We are a leading specialty retailer of automotive aftermarket parts, accessories, batteries and maintenance items primarily
operating within the United States. Our stores carry an extensive product line for cars, vans, sport utility vehicles and light
trucks. We serve both DIY and Commercial customers. Our Commercial customers consist primarily of delivery customers for
whom we deliver product from our store locations to our Commercial customers' places of business, including independent
garages, service stations and auto dealers. At December 29, 2012, we operated 3,794 stores throughout 39 states, Puerto Rico
and the Virgin Islands.
We operate in two reportable segments: Advance Auto Parts, or AAP, and Autopart International, or AI. The AAP segment
is comprised of our store operations within the Northeastern, Mid-Atlantic, Southeastern and Midwestern (inclusive of South
Central) regions of the United States, Puerto Rico and the Virgin Islands. These stores operate under the trade name “Advance
Auto Parts” except for certain stores in the state of Florida, which operate under the “Advance Discount Auto Parts” trade
name. At December 29, 2012, we operated 3,576 stores in the AAP segment. Our AAP stores offer a broad selection of brand
name and proprietary automotive replacement parts, accessories and maintenance items for domestic and imported cars and
light trucks. Through our integrated operating approach, we serve our DIY and Commercial customers from our store locations
and online at www.AdvanceAutoParts.com. Our online website allows our DIY customers to pick up merchandise at a
conveniently located store or have their purchases shipped directly to their home or business. Our Commercial customers can
conveniently place their orders online.
At December 29, 2012, we operated 218 stores in the AI segment under the “Autopart International” trade name. AI's
business serves the Commercial market from its store locations primarily in the Northeastern, Mid-Atlantic and Southeastern
regions of the United States.
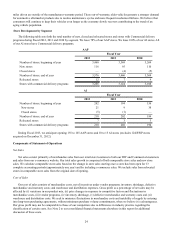
Management Overview
We generated earnings per diluted share, or diluted EPS, of $5.22 during Fiscal 2012 compared to $5.11 for Fiscal 2011.
The increase in our diluted EPS was driven by a lower average share count during Fiscal 2012, partially offset by a decrease in
operating income. Throughout most of Fiscal 2012, our sales remained constrained, particularly in our colder weather markets,
driven by the unseasonably warmer temperatures which has decreased the demand for failure and maintenance parts. The
uncertainty in the U.S. economy also impacted our sales consistent with many other retailers, including our peer companies in
the automotive aftermarket industry, as consumers faced high unemployment, fluctuating gas prices and low consumer
confidence. In response to the difficult sales environment, we focused on providing better service to our Commercial customers
and improving weekend staffing to better serve our DIY customers. Despite our lower performance in Fiscal 2012, we remain
encouraged by (i) the long-term dynamics of the automotive aftermarket industry, (ii) initiatives that are underway in support of
our strategies and (iii) our growth potential in the more fragmented and faster growing Commercial market.
While our operating income in Fiscal 2012 declined from the comparable period of last year, we generated a significant
amount of operating cash flow to enable us to invest in capital projects and initiatives to support our strategies. As discussed
later in the "Business and Industry Update," we remain committed to investing in our two key strategies – Superior Availability
and Service Leadership.