Advance Auto Parts 2012 Annual Report Download - page 35
Download and view the complete annual report
Please find page 35 of the 2012 Advance Auto Parts annual report below. You can navigate through the pages in the report by either clicking on the pages listed below, or by using the keyword search tool below to find specific information within the annual report.-
 1
1 -
2
-
3
-
4
-
5
-
6
-
7
-
8
-
9
-
10
-
11
-
12
-
13
-
14
-
15
-
16
-
17
-
18
-
19
-
20
-
21
-
22
-
23
-
24
-
 25
25 -
 26
26 -
 27
27 -
 28
28 -
 29
29 -
 30
30 -
 31
31 -
 32
32 -
 33
33 -
 34
34 -
 35
35 -
 36
36 -
 37
37 -
 38
38 -
 39
39 -
 40
40 -
 41
41 -
 42
42 -
 43
43 -
 44
44 -
 45
45 -
46
-
47
-
48
-
49
-
50
-
51
-
52
-
53
-
54
-
55
-
56
-
57
-
58
-
59
-
60
-
61
-
62
-
63
-
64
-
65
-
66
-
67
-
68
-
69
-
70
-
71
-
72
-
73
-
74
-
75
-
76
-
77
-
78
-
79
-
80
-
81
-
82
-
83
-
84
-
85
-
86
-
87
-
88
-
89
-
90
-
91
-
92
-
93
-
94
-
95
-
96
-
97
-
98
-
99
-
100
 |
 |

28
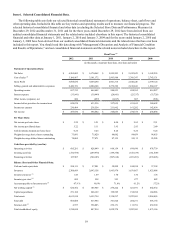
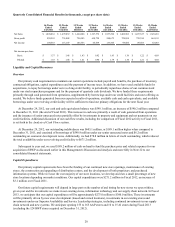
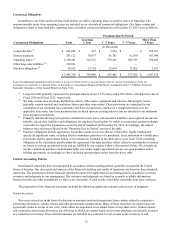
Quarterly Consolidated Financial Results (in thousands, except per share data)
16-Weeks
Ended
4/23/2011
12-Weeks
Ended
7/16/2011
12-Weeks
Ended
10/8/2011
12-Weeks
Ended
12/31/2011
16-Weeks
Ended
4/21/2012
12-Weeks
Ended
7/14/2012
12-Weeks
Ended
10/6/2012
12-Weeks
Ended
12/29/2012
Net Sales $ 1,898,063 $ 1,479,839 $ 1,464,988 $ 1,327,572 $ 1,957,292 $ 1,460,983 $ 1,457,527 $ 1,329,201
Gross profit 958,201 735,848 724,503 650,738 980,673 728,858 725,350 663,155
Net income 109,583 113,107 105,553 66,439 133,506 99,606 89,503 65,055
Net income per share:
Basic $ 1.37 $ 1.48 $ 1.43 $ 0.92 $ 1.83 $ 1.36 $ 1.22 $ 0.89
Diluted $ 1.35 $ 1.46 $ 1.41 $ 0.90 $ 1.79 $ 1.34 $ 1.21 $ 0.88
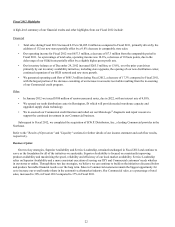
Liquidity and Capital Resources
Overview
Our primary cash requirements to maintain our current operations include payroll and benefits, the purchase of inventory,
contractual obligations, capital expenditures and the payment of income taxes. In addition, we have used available funds for
acquisitions, to repay borrowings under our revolving credit facility, to periodically repurchase shares of our common stock
under our stock repurchase programs and for the payment of quarterly cash dividends. We have funded these requirements
primarily through cash generated from operations, supplemented by borrowings under our credit facilities and notes offering as
needed. We believe funds generated from our expected results of operations, available cash and cash equivalents, and available
borrowings under our revolving credit facility will be sufficient to fund our primary obligations for the next fiscal year.
At December 29, 2012, our cash and cash equivalents balance was $598.1 million, an increase of $540.2 million compared
to December 31, 2011 (the end of Fiscal 2011). This increase in cash was primarily a result of cash generated from operations
and the issuance of senior unsecured notes partially offset by investments in property and equipment and net payments on our
credit facilities. Additional discussion of our cash flow results, including the comparison of Fiscal 2012 activity to Fiscal 2011,
is set forth in the Analysis of Cash Flows section.
At December 29, 2012, our outstanding indebtedness was $605.1 million, or $189.1 million higher when compared to
December 31, 2011, and consisted of borrowings of $598.9 million under our senior unsecured notes and $6.2 million
outstanding on economic development notes. Additionally, we had $78.8 million in letters of credit outstanding, which reduced
the total availability under our revolving credit facility to $671.2 million.
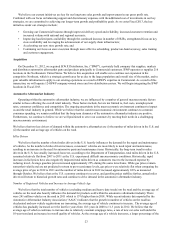
Subsequent to year end, we used $188.2 million of cash on hand to fund the purchase price and related expenses for our
acquisition of BWP as discussed earlier in this Management's Discussion and Analysis and more fully in Note 22 to our
consolidated financial statements.
Capital Expenditures
Our primary capital requirements have been the funding of our continued new store openings, maintenance of existing
stores, the construction and upgrading of distribution centers, and the development of both proprietary and purchased
information systems. While we lease the vast majority of our store locations, we develop and own a small percentage of new
store locations depending on market conditions. Our capital expenditures were $271.2 million in Fiscal 2012, an increase of
$3.1 million over Fiscal 2011.
Our future capital requirements will depend in large part on the number of and timing for new stores we open within a
given year and the investments we make in our existing stores, information technology and our supply chain network. In Fiscal
2013, we anticipate that our capital expenditures will be approximately $275.0 million to $300.0 million. These investments
will be primarily driven by new store development (leased and owned locations), investments in our existing stores and
investments under our Superior Availability and Service Leadership strategies, including continued investments in our supply
chain network and new systems. We anticipate opening 155 to 165 AAP stores and 10 to 15 AI stores during Fiscal 2013
(excluding the 124 BWP stores acquired on December 31, 2012).