Advance Auto Parts 2012 Annual Report Download - page 81
Download and view the complete annual report
Please find page 81 of the 2012 Advance Auto Parts annual report below. You can navigate through the pages in the report by either clicking on the pages listed below, or by using the keyword search tool below to find specific information within the annual report.-
 1
1 -
2
-
3
-
4
-
5
-
6
-
7
-
8
-
9
-
10
-
11
-
12
-
13
-
14
-
15
-
16
-
17
-
18
-
19
-
20
-
21
-
22
-
23
-
24
-
25
-
26
-
27
-
28
-
29
-
30
-
31
-
32
-
33
-
34
-
35
-
36
-
37
-
38
-
39
-
40
-
41
-
42
-
43
-
44
-
45
-
46
-
47
-
48
-
49
-
50
-
51
-
52
-
53
-
54
-
55
-
56
-
57
-
58
-
59
-
60
-
61
-
62
-
63
-
64
-
65
-
66
-
67
-
68
-
69
-
70
-
 71
71 -
 72
72 -
 73
73 -
 74
74 -
 75
75 -
 76
76 -
 77
77 -
 78
78 -
 79
79 -
 80
80 -
 81
81 -
 82
82 -
 83
83 -
 84
84 -
 85
85 -
 86
86 -
 87
87 -
 88
88 -
 89
89 -
 90
90 -
 91
91 -
92
-
93
-
94
-
95
-
96
-
97
-
98
-
99
-
100
 |
 |

F-36
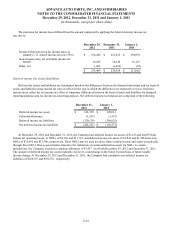
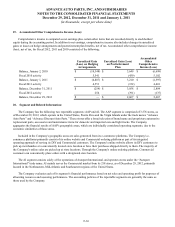
19. Accumulated Other Comprehensive Income (Loss):
Comprehensive income is computed as net earnings plus certain other items that are recorded directly to stockholders'
equity during the accounting period. In addition to net earnings, comprehensive income also includes changes in unrealized
gains or losses on hedge arrangements and postretirement plan benefits, net of tax. Accumulated other comprehensive income
(loss), net of tax, for Fiscal 2012, 2011 and 2010 consisted of the following:
Unrealized Gain
(Loss) on Hedging
Arrangements
Unrealized Gain (Loss)
on Postretirement
Plan
Accumulated
Other
Comprehensive
Income (Loss)
Balance, January 2, 2010 $ (10,348) $ 3,649 $ (6,699)
Fiscal 2010 activity 5,541 (439) 5,102
Balance, January 1, 2011 $ (4,807) $ 3,210 $ (1,597)
Fiscal 2011 activity 4,553 (152) 4,401
Balance, December 31, 2011 $ (254) $ 3,058 $ 2,804
Fiscal 2012 activity 254 (391)(137)
Balance, December 29, 2012 $ — $ 2,667 $ 2,667
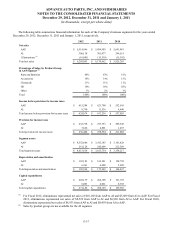
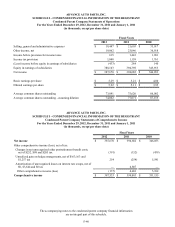
20. Segment and Related Information:
The Company has the following two reportable segments: AAP and AI. The AAP segment is comprised of 3,576 stores, as
of December 29, 2012, which operate in the United States, Puerto Rico and the Virgin Islands under the trade names “Advance
Auto Parts” and “Advance Discount Auto Parts.” These stores offer a broad selection of brand name and proprietary automotive
replacement parts, accessories and maintenance items for domestic and imported cars and light trucks. The Company
aggregates the financial results of AAP's geographic areas, which are individually considered operating segments, due to the
economic similarities of those areas.
Included in the Company's geographic areas are sales generated from its e-commerce platforms. The Company's e-
commerce platforms primarily consist of its online website and Commercial ordering platform as part of its integrated
operating approach of serving its DIY and Commercial customers. The Company's online website allows its DIY customers to
pick up merchandise at a conveniently located store location or have their purchases shipped directly to them. The majority of
the Company's online sales are picked up at store locations. Through the Company's online ordering platform, Commercial
customers can conveniently place orders with a designated store location.
The AI segment consists solely of the operations of Autopart International, and operates stores under the “Autopart
International” trade name. AI mainly serves the Commercial market from its 218 stores, as of December 29, 2012, primarily
located in the Northeastern, Mid-Atlantic and Southeastern regions of the United States.
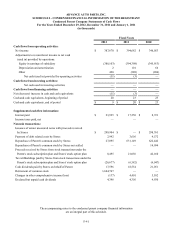
The Company evaluates each of its segment’s financial performance based on net sales and operating profit for purposes of
allocating resources and assessing performance. The accounting policies of the reportable segments are generally the same as
those used by the Company.
ADVANCE AUTO PARTS, INC. AND SUBSIDIARIES
NOTES TO THE CONSOLIDATED FINANCIAL STATEMENTS
December 29, 2012, December 31, 2011 and January 1, 2011
(in thousands, except per share data)