Advance Auto Parts 2012 Annual Report Download - page 32
Download and view the complete annual report
Please find page 32 of the 2012 Advance Auto Parts annual report below. You can navigate through the pages in the report by either clicking on the pages listed below, or by using the keyword search tool below to find specific information within the annual report.-
 1
1 -
2
-
3
-
4
-
5
-
6
-
7
-
8
-
9
-
10
-
11
-
12
-
13
-
14
-
15
-
16
-
17
-
18
-
19
-
20
-
21
-
 22
22 -
 23
23 -
 24
24 -
 25
25 -
 26
26 -
 27
27 -
 28
28 -
 29
29 -
 30
30 -
 31
31 -
 32
32 -
 33
33 -
 34
34 -
 35
35 -
 36
36 -
 37
37 -
 38
38 -
 39
39 -
 40
40 -
 41
41 -
 42
42 -
43
-
44
-
45
-
46
-
47
-
48
-
49
-
50
-
51
-
52
-
53
-
54
-
55
-
56
-
57
-
58
-
59
-
60
-
61
-
62
-
63
-
64
-
65
-
66
-
67
-
68
-
69
-
70
-
71
-
72
-
73
-
74
-
75
-
76
-
77
-
78
-
79
-
80
-
81
-
82
-
83
-
84
-
85
-
86
-
87
-
88
-
89
-
90
-
91
-
92
-
93
-
94
-
95
-
96
-
97
-
98
-
99
-
100
 |
 |

25
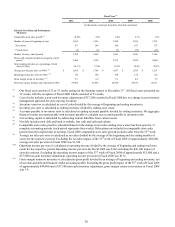
Selling, General and Administrative Expenses
SG&A expenses consist of store payroll, store occupancy (including rent and depreciation), advertising expenses,
Commercial delivery expenses, other store expenses and general and administrative expenses, including salaries and related
benefits of store support center Team Members, share-based compensation expense, store support center administrative office
expenses, data processing, professional expenses, self-insurance costs, closed store expense, impairment charges, if any, and
other related expenses. See Note 2 to our consolidated financial statements for additional discussion of these costs.
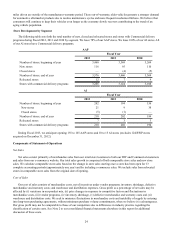
Consolidated Results of Operations
The following table sets forth certain of our operating data expressed as a percentage of net sales for the periods indicated.
Fiscal Year Ended
December 29,
2012
December 31,
2011
January 1,
2011
Net sales 100.0% 100.0% 100.0%
Cost of sales, including purchasing and
warehousing costs 50.1 50.3 50.0
Gross profit 49.9 49.7 50.0
Selling, general and administrative expenses 39.3 39.0 40.1
Operating income 10.6 10.8 9.9
Interest expense (0.5)(0.5)(0.5)
Other, net 0.0 0.0 0.0
Provision for income taxes 3.8 3.9 3.6
Net income 6.2% 6.4% 5.8%
Fiscal 2012 Compared to Fiscal 2011
Net Sales
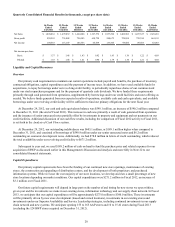
Net sales for Fiscal 2012 were $6,205.0 million, an increase of $34.5 million, or 0.6%, over net sales for Fiscal 2011. This
growth was primarily due to sales from AAP and AI stores added within the last year partially offset by a decrease in
comparable store sales.
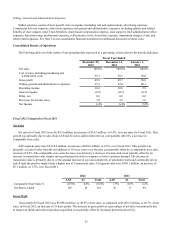
AAP segment sales were $5,914.9 million, an increase of $30.0 million, or 0.5%, over Fiscal 2011. This growth was
primarily a result of sales from the net addition of 116 new stores over the past year partially offset by a comparable store sales
decrease of 0.9%. The comparable store sales decrease was driven by a decrease in transaction count partially offset by an
increase in transaction value despite more promotional activity in response to lower customer demand. The increase in
transaction value is primarily due to (i) the gradual increase in cost and complexity of automotive parts and commodity prices
and (ii) and the positive impact from a higher mix of Commercial sales. AI segment sales were $306.1 million, an increase of
$5.1 million, or 1.7%, over Fiscal 2011.
2012 2011
AAP AI Total AAP AI Total
Comparable Store Sales % (0.9)% 0.8% (0.8)% 1.9% 8.6% 2.2%
Net Stores Added 116 16 132 91 8 99
Gross Profit
Gross profit for Fiscal 2012 was $3,098.0 million, or 49.9% of net sales, as compared to $3,069.3 million, or 49.7% of net
sales, in Fiscal 2011, an increase of 19 basis points. The increase in gross profit as a percentage of net sales was primarily due
to improved shrink and reduced product acquisition costs partially offset by increased promotional activity.