Acer 2010 Annual Report Download - page 7
Download and view the complete annual report
Please find page 7 of the 2010 Acer annual report below. You can navigate through the pages in the report by either clicking on the pages listed below, or by using the keyword search tool below to find specific information within the annual report.-
 1
1 -
 2
2 -
 3
3 -
 4
4 -
 5
5 -
 6
6 -
 7
7 -
 8
8 -
 9
9 -
 10
10 -
 11
11 -
 12
12 -
 13
13 -
 14
14 -
 15
15 -
 16
16 -
 17
17 -
 18
18 -
19
-
20
-
21
-
22
-
23
-
24
-
25
-
26
-
27
-
28
-
29
-
30
-
31
-
32
-
33
-
34
-
35
-
36
-
37
-
38
-
39
-
40
-
41
-
42
-
43
-
44
-
45
-
46
-
47
-
48
-
49
-
50
-
51
-
52
-
53
-
54
-
55
-
56
-
57
-
58
-
59
-
60
-
61
-
62
-
63
-
64
-
65
-
66
-
67
-
68
-
69
-
70
-
71
 |
 |

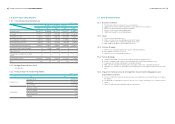
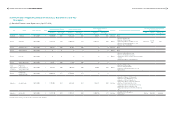
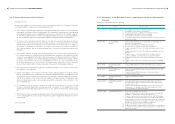
1.2 2010 Operating Report
1.2.1 Consolidated Operating Results
Unit: NT$ Thousand
Period
Item
Most Recent 5-Year Financial Information
2006 2007 2008 2009 2010
Operating revenue 350,816,353 462,066,080 546,274,115 573,982,544 629,058,973
Gross profit 38,171,313 47,418,310 57,285,660 58,327,860 64,481,268
Operating (loss) income 7,462,446 10,185,123 14,072,302 15,339,466 18,203,913
Non-operating income and gain 9,266,120 6,699,671 5,353,038 1,719,037 4,321,397
Non-operating expense and loss 3,180,259 1,776,157 4,618,613 2,075,520 3,195,923
Continuing operating income before tax 13,548,307 15,108,637 14,806,728 14,982,983 19,329,387
Income(loss) from discontinuned segment 0 517,866 99,843 0 0
Extraordiniary items 0 0 0 0 0
Cumulative effect of changes in accounting
principle 0 0 0 0 0
Income after income taxes 10,218,242 12,958,933 11,742,135 11,353,374 15,117,997
EPS 4.16 5.27 4.67 4.31 5.71
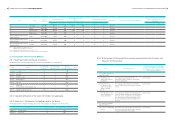
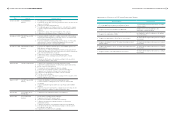
1.2.2 Budget Expenditure in 2010
Not applicable.
1.2.3 Financial Income and Earning Abilities
Unit: NT$ Thousand
Item 2010
Financial Income
Operating revenue 629,058,973
Gross profit 64,481,268
Income after tax 15,117,997
Earning Abilities
Return on assets(%) 5.59
Return on equity(%) 16.17
Net income ratio (%) 2.40
EPS (NTD) 5.71
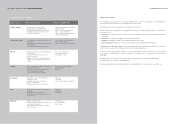
1.3 2011 Business Plan
1.3.1 Business Direction
A. The personal computer continues to be our core business.
B. Aggressively yet cautiously develop tablet PCs, with sufficient resource allocation.
C. Develop an effective winning strategy for smartphone.
D. Enhance commercial PC marketing and sales.
E. Significantly expand into key emerging markets.
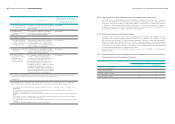
1.3.2 Goals
A. Pursue for better operating income.
B. Enhance our position as a world-leading notebook PC vendor.
C. Enter the tablet PC space and quickly build up market share.
D. Make significant progress in the smartphone business.
1.3.3 Partner Strategy
A. Reinforce our cooperation with first-tier suppliers and channel partners.
B. Fully capitalize on partners’ resources.
C. Share the success by rewarding our partners.
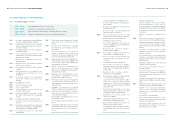
1.3.4 Future Strategy
A. Achieve a better balance of revenues from regional operations and product lines.
B. Enhance company speed, efficiency, product quality, while lowering operating expense ratio.
C. Create value for customers and enhance our brand positioning.
D. Ride on the ICT wave and seize the business opportunity; create a new competitive momentum.
E. Strengthen our innovation on mobile devices, by enabling users to enjoy digital contents and services with
ease.
1.3.5 Impact on Company Due to Competition, Governmental Regulations and
Overall Macro Market
A. The rise of tablet PCs and open operating systems has brought about a profound change on the global
ICT industry.
B. The demand for mobile devices that offer easy access to internet shall impact on consumer notebook
growth.
C. Year 2011 shall bring many challenges and also opportunities.
ACER INCORPORATED
2010 ANNUAL REPORT
10
BUSINESS REPORT
11