Acer 2010 Annual Report Download - page 51
Download and view the complete annual report
Please find page 51 of the 2010 Acer annual report below. You can navigate through the pages in the report by either clicking on the pages listed below, or by using the keyword search tool below to find specific information within the annual report.-
 1
1 -
2
-
3
-
4
-
5
-
6
-
7
-
8
-
9
-
10
-
11
-
12
-
13
-
14
-
15
-
16
-
17
-
18
-
19
-
20
-
21
-
22
-
23
-
24
-
25
-
26
-
27
-
28
-
29
-
30
-
31
-
32
-
33
-
34
-
35
-
36
-
37
-
38
-
39
-
40
-
 41
41 -
 42
42 -
 43
43 -
 44
44 -
 45
45 -
 46
46 -
 47
47 -
 48
48 -
 49
49 -
 50
50 -
 51
51 -
 52
52 -
 53
53 -
 54
54 -
 55
55 -
 56
56 -
 57
57 -
 58
58 -
 59
59 -
 60
60 -
 61
61 -
62
-
63
-
64
-
65
-
66
-
67
-
68
-
69
-
70
-
71
 |
 |

ACER INCORPORATED
2010 ANNUAL REPORT
98
FINANCIAL STANDING
99
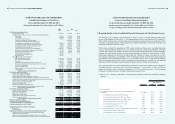
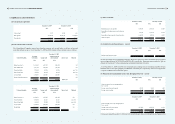
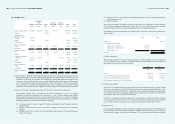
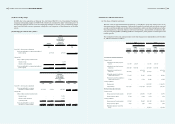
(b) The details of inventory write downs for the years ended December 31, 2009 and 2010 were as follows:
December 31, 2009 December 31, 2010
NT$ NT$ US$
Write-down of inventories to net realizable value 3,278,468 5,305,618 182,136
Net loss on physical inventory 83,177 20,500 704
Scrap loss 45,329 698,201 23,968
3,406,974 6,024,319 206,808
(8) Non-current assets held for sale
In December 2010, the Company’s board of directors resolved to sell ETEN’s office building located in
Taipei. As of December 31, 2010, the carrying value of this building was NT$1,827,855. The Company is
expecting to complete the sale thereof in 2011.
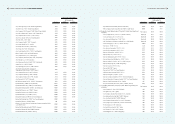
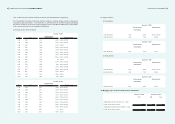
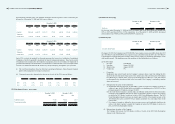
(9) Financial assets carried at cost-non-current
December 31, 2009 December 31, 2010
NT$ NT$ US$
Investment in non-publicly traded equity securities:
Prosperity Venture Capital Corp. 21,000 - -
Sheng-Hua Venture Capital Corp. 11,900 - -
Legend Technology 11,235 8,435 290
W.I. Harper International Corp. 14,359 14,359 493
InCOMM Technologies Co., Ltd. 2,360 2,360 81
IP Fund II 32,400 16,592 570
Dragon Investment Co. Ltd. 217,000 217,000 7,449
World Venture, Inc. 262,000 262,000 8,994
iD Reengineering Inc. 174,900 174,900 6,004
DYNA Fund II 23,166 - -
IP Fund III 128,696 117,044 4,018
iD5 Fund L.P. 72,956 62,681 2,152
IP Cathay One, L.P. 258,558 235,148 8,072
IP Fund One L.P. 736,379 394,218 13,533
ID5 Annex I Fund 22,308 766
Apacer Technology Inc. 45,340 - -
New Century Infocomm Tech Co., Ltd. 131,340 - -
Trimode Technology Inc. 11,038 11,038 379
FuHu Inc. - 111,895 3,841
Others 96,431 72,699 2,496
2,251,058 1,722,677 59,138
In 2010, the Consolidated Companies increased its equity investments in ID5 Annex I Fund by NT$24,529.
In 2009, IP Cathay One, L.P., IP Fund One, L.P., Legend Technology, W.I. Harper International, and Sheng-
Hua Venture capital and other investees returned capital of NT$170,716 to the Consolidated Companies. In
2010, IP Fund One, L.P., iD5 Fund, L.P., Prosperity Venture Capital Corp., Sheng-Hua Venture Capital Corp.,
IP Fund II and other investees distributed or returned capital for an aggregate amount of NT$433,470 to the
Consolidated Companies.
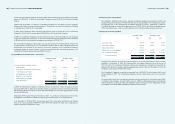
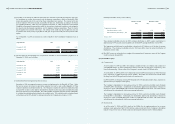
In 2010, the Consolidated Companies sold their investments in New Century Infocomm Tech Co., Ltd. and
the common shares of iRobot distributed by iD5 Fund L.P., which resulted in an aggregate disposal gain of
NT$238,687.
Commencing from December 29, 2010, the investments in Apacer Technology Inc. were reclassified as
“available-for-sale nancial assets – noncurrent” when Apacer’s common shares were publicly listed on the
Taiwan Stock Exchange.
For the year ended December 31, 2009, the Consolidated Companies recognized impairment losses of
NT$231,934 on the investments in New Century Infocomm Tech Co., Ltd. and other investees.
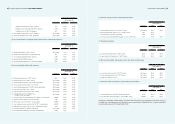
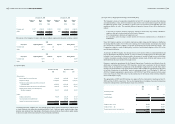
(10) Long-term equity investments accounted for using equity method
December 31, 2009 2009
Percentage of
ownership Carrying amount
Investment
income (loss)
%NT$ NT$
Wistron Corporation (“Wistron”) 4.40 2,334,164 424,441
E-Life Mall Corp. (“e-Life”) 14.27 434,174 55,976
Aegis Semiconductor Technology Inc. 44.04 165,235 -
ECOM Software Inc. 33.93 36,310 3,791
Bluechip Infotech Pty Ltd. 33.41 72,303 4,605
FuHu Inc. (“FuHu”) 25.00 172,982 (26,740)
Olidata S.p.A (“Olidata”) 29.90 116,579 -
Others (16,797) 1,737
3,314,950 463,810
Less: Allocation of corporate expenses (63,712)
400,098
December 31, 2010 2010
Percentage of
ownership Carrying amount
Investment
income (loss)
%NT$ US$ NT$ US$
Wistron Corporation 2.60 1,485,662 51,001 489,525 16,805
E-Life Mall Corp. 12.84 355,648 12,209 59,248 2,034
Aegis Semiconductor Technology Inc. 44.04 165,235 5,672 - -
ECOM Software Inc. 33.93 39,002 1,339 5,000 172
Bluechip Infotech Pty Ltd. 33.41 79,310 2,723 7,875 270
FuHu Inc. 18.63 - - (49,754) (1,708)
Fizzle Investment Limited 20.00 124,760 4,283 - -
Olidata S.p.A 29.90 - - (100,271) (3,442)
Others - (13,916) (478) 2,728 93
2,235,701 76,749 414,351 14,224
Less: Allocation of corporate expenses (38,403) (1,318)
375,948 12,906