Acer 2010 Annual Report Download - page 19
Download and view the complete annual report
Please find page 19 of the 2010 Acer annual report below. You can navigate through the pages in the report by either clicking on the pages listed below, or by using the keyword search tool below to find specific information within the annual report.-
 1
1 -
2
-
3
-
4
-
5
-
6
-
7
-
8
-
 9
9 -
 10
10 -
 11
11 -
 12
12 -
 13
13 -
 14
14 -
 15
15 -
 16
16 -
 17
17 -
 18
18 -
 19
19 -
 20
20 -
 21
21 -
 22
22 -
 23
23 -
 24
24 -
 25
25 -
 26
26 -
 27
27 -
 28
28 -
 29
29 -
30
-
31
-
32
-
33
-
34
-
35
-
36
-
37
-
38
-
39
-
40
-
41
-
42
-
43
-
44
-
45
-
46
-
47
-
48
-
49
-
50
-
51
-
52
-
53
-
54
-
55
-
56
-
57
-
58
-
59
-
60
-
61
-
62
-
63
-
64
-
65
-
66
-
67
-
68
-
69
-
70
-
71
 |
 |

ACER INCORPORATED
2010 ANNUAL REPORT
34
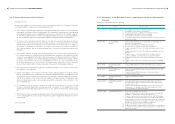
CAPITAL AND SHARES
35
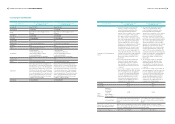
4.1 Sources of Capital
4.1.1 Sources of Capital (April 17, 2011)
Unit: Share/NT$ Thousand
Date Price of Issuance Authorized Common stock Paid-in Common stock Notes
Shares Value Shares Value
April, 2011 Share/NT$10 3,500,000,000 35,000,000 2,703,605,497 27,036,055 -
Unit: Share
Shares
Category
Authorized capital Notes
Issued shares Non-issued Total
Common shares 2,703,605,497 796,394,503 3,500,000,000 -
4.1.2 Shareholding Structure (April 17, 2011)
Unit: Share
Category/Number Government
Institution
Financial
Institution
Other
Institution Individual FINI and Foreign
Investors Total
No. of Shareholders 19 30 555 328,673 1,081 330,358
Shares 47,006,999 39,084,519 207,548,670 1,205,178,364 1,204,786,945 2,703,605,497
Percentage 1.74% 1.45% 7.67% 44.58% 44.56% 100.00%
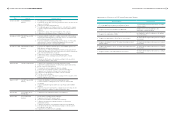
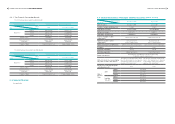
4.1.3 Distribution of Shareholdings (April 17, 2011)
Category No. of Shareholders Shares Percentage
1 ~ 999 144,144 42,166,700 1.560 %
1,000 ~ 5,000 143,587 303,682,849 11.233 %
5,001 ~ 10,000 23,860 175,831,816 6.504 %
10,001 ~ 15,000 7,243 87,979,315 3.254 %
15,001 ~ 20,000 3,844 69,080,114 2.555 %
20,001 ~ 30,000 3,095 76,398,165 2.826 %
30,001 ~ 50,000 2,127 82,445,975 3.050 %
50,001 ~ 100,000 1,280 90,137,668 3.334 %
100,001 ~ 200,000 521 71,833,601 2.657 %
200,001 ~ 400,000 239 68,350,793 2.528 %
400,001 ~ 600,000 101 49,169,932 1.819 %
600,001 ~ 800,000 54 38,143,135 1.411 %
800,001 ~ 1,000,000 43 38,446,912 1.422 %
1,000,001 and above 220 1,509,938,522 55.849 %
Total 330,358 2,703,605,497 100.000 %
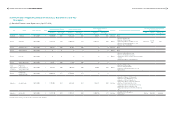
4.1.4 List of Major Shareholders (April 17, 2011)
Item
Name Shares Percentage
JPMorgan Chase Bank N.A. Taipei Branch in custody for Capital World Growth and
Income Fund Inc. 143,445,687 5.31 %
MAGELLAN 75,000,000 2.77 %
Stan Shih 74,806,719 2.77 %
Hung Rouan Investment Corp. 67,799,202 2.51 %
JPMorgan Chase Bank N.A. Taipei Branch in custody for Capital Income Builder 56,751,864 2.10 %
Acer GDR 47,143,325 1.74 %
COMGEST GROWTH PLC 47,050,940 1.74 %
JPMorgan Chase Bank N.A. Taipei Branch in custody for EuroPacific Growth Fund 41,706,024 1.54 %
VANGUARD EMERGING MARKETS STOCK INDEX FUND, A SERIES OF VANGUARD
INTERNATIONAL EQUITY INDEX FUNDS 39,911,105 1.48 %
Labor Pension Fund Supervisory Committee 28,360,628 1.05 %
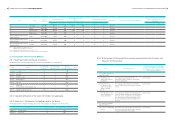
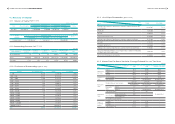
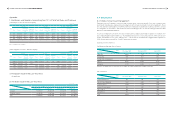
4.1.5 Market Price Per Share, Net Value, Earning& Dividend For Last Two Years
Unit: NT$
Period
Item 2009 2010 Until Mar. 31st, 2011
Market Price
Per Share
Highest 96.20 103.00 90.00
Lowest 39.65 73.50 60.00
Average 65.58 86.47 75.63
Net Value Per
Share
Before Distribution 34.98 35.32 36.30
After Distribution 31.82 Un-appropriated Un-appropriated
Earning Per
Share
Weighted Average Share Numbers
2,635,011 2,647,466 2,655,826
Thousand shares Thousand shares Thousand shares
Earning Per
Share
Current 4.31 5.71 0.45
Adjusted 4.31 Un-appropriated Un-appropriated
Dividend Per
Share
Cash Dividend (NT$) 3.1 3.6
Un-appropriated
Stock Dividend
Retained Earning (%) 0.01 -
Capital Surplus (%) - -
Accumulated unpaid dividends - - -
Return on
Investment
Analysis
P/E Ratio 15.22 15.14 -
P/D Ratio 21.15 24.02 -
Cash Dividend Yield 4.73% 4.16% -