Acer 2010 Annual Report Download - page 41
Download and view the complete annual report
Please find page 41 of the 2010 Acer annual report below. You can navigate through the pages in the report by either clicking on the pages listed below, or by using the keyword search tool below to find specific information within the annual report.-
 1
1 -
2
-
3
-
4
-
5
-
6
-
7
-
8
-
9
-
10
-
11
-
12
-
13
-
14
-
15
-
16
-
17
-
18
-
19
-
20
-
21
-
22
-
23
-
24
-
25
-
26
-
27
-
28
-
29
-
30
-
 31
31 -
 32
32 -
 33
33 -
 34
34 -
 35
35 -
 36
36 -
 37
37 -
 38
38 -
 39
39 -
 40
40 -
 41
41 -
 42
42 -
 43
43 -
 44
44 -
 45
45 -
 46
46 -
 47
47 -
 48
48 -
 49
49 -
 50
50 -
 51
51 -
52
-
53
-
54
-
55
-
56
-
57
-
58
-
59
-
60
-
61
-
62
-
63
-
64
-
65
-
66
-
67
-
68
-
69
-
70
-
71
 |
 |

ACER INCORPORATED
2010 ANNUAL REPORT
78
FINANCIAL STANDING
79
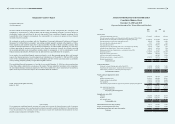
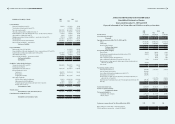
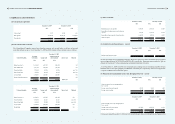
ACER INCORPORATED AND SUBSIDIARIES
Consolidated Statements of Cash Flows
Years ended December 31, 2009 and 2010
(Expressed in thousands of New Taiwan dollars and US dollars)
2009 2010
NT$ NT$ US$
Cash ows from operating activities:
Consolidated net income 11,352,860 15,118,140 518,989
Adjustments to reconcile net income to cash provided by operating activities:
Depreciation 846,303 704,486 24,184
Amortization 1,860,284 1,891,118 64,920
Stock-based compensation cost 298,592 458,736 15,748
Unrealized exchange gain on bonds payable - (1,239,955) (42,566)
Amortization of bond discount and transaction costs - 171,597 5,891
Investment gain recognized using equity method, net (463,810) (414,351) (14,224)
Cash dividends received from equity method investments 143,037 280,117 9,616
Loss (gain) on disposal of property and equipment, net 103,055 (82,974) (2,849)
Gain on disposal of investments, net (79,162) (2,376,407) (81,579)
Valuation loss (gain) on nancial assets and liabilities (1,293,844) 1,899,825 65,219
Impairment loss of non-nancial assets, net of reversal gain 395,109 378,178 12,982
Deferred income tax expense (benet) (951,327) 826,484 28,372
Other investment loss (gain), net 227,698 (30,085) (1,033)
Gain on disposal of intangible assets (46,037) - -
Restructuring cost 164,595 - -
Changes in operating assets and liabilities:
Notes and accounts receivable (4,032,056) 10,127,478 347,665
Receivables from related parties 241,158 (118,718) (4,076)
Inventories (11,173,624) 9,882,344 339,250
Other receivable, prepayments and other current assets (951,160) 1,007,844 34,598
Non-current receivable (under other nancial assets ‒ non-current) 69,926 (64,506) (2,214)
Notes and accounts payable 31,466,106 (11,597,095) (398,115)
Payables to related parties 2,384,367 (2,021,186) (69,385)
Royalties payable, accrued expenses and other current liabilities 8,088,125 (11,509,119) (395,095)
Other liabilities (458,091) (54,044) (1,855)
Cash provided by operating activities 38,192,104 13,237,907 454,443
Cash ows from investing activities:
Proceeds from disposal of investments 1,042,680 4,069,972 139,718
Acquisition of long-term investments (259,905) (149,289) (5,125)
Proceeds from capital return or liquidation of investees 231,897 480,100 16,481
Additions to property, plant and equipment and property not used in operation (771,575) (1,113,394) (38,222)
Proceeds from disposal of property and equipment and property not used in operation 75,067 527,724 18,116
Decrease (increase) in advances to related parties 23,666 (25,407) (872)
Decrease (increase) in restricted deposits 922,794 (24,197) (831)
Additions to intangible assets (2,785,947) (6,211,750) (213,242)
Proceeds from disposal of intangible assets 25,000 - -
Increase in refundable deposits, deferred charges, and other assets (291,932) (186,000) (6,385)
Cash used in by investing activities (1,788,255) (2,632,241) (90,362)
Cash ows from nancing activities:
Increase (decrease) in short-term borrowings (538,792) 1,103,571 37,884
Issuance of convertible bonds - 15,865,788 544,655
Repayment of long-term debt (10,702) (49,923) (1,714)
Distribution of cash dividends (5,215,456) (8,218,416) (282,129)
Proceeds from exercise of employee stock option 103,590 205,812 7,065
Decrease in minority interests (63,768) (81,273) (2,790)
Cash provided by (used in) nancing activities (5,725,128) 8,825,559 302,971
Effects of exchange rate changes 795,621 (4,590,906) (157,601)
Net increase in cash and cash equivalents 31,474,342 14,840,319 509,451
Cash and cash equivalents at beginning of period 22,141,725 53,616,067 1,840,579
Cash and cash equivalents at end of period 53,616,067 68,456,386 2,350,030
Supplemental disclosures of cash ow information:
Interest paid 444,067 839,977 28,835
Income taxes paid 3,196,014 5,794,408 198,915
Supplementary disclosures of non-cash investing and nancing activities:
Change in unrealized valuation gain (loss) on nancial instruments 2,743,948 (553,717) (19,008)
Current portion of long-term debt - 6,100,000 209,406
Additions to property and equipment included in other current liabilities - 99,670 3,422
Decrease in valuation allowance of deferred income tax assets against goodwill - 1,770,123 60,766
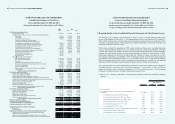
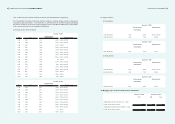
ACER INCORPORATED AND SUBSIDIARIES
Notes to Consolidated Financial Statements
As of and for the years ended December 31, 2009 and 2010
(amounts expressed in thousands of New Taiwan dollars and US dollars,
except for earnings per share information and unless otherwise noted)
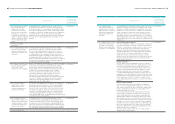
1. Reporting Entities of the Consolidated Financial Statements and Their Business Scopes
Acer Sertek Inc. (the “Company”) was incorporated on August 1, 1976, as a company limited by shares under
the laws of the Republic of China (“ROC”). The Company merged with Acer Incorporated (“AI”) on March 27,
2002, with the Company as the surviving entity from the merger but renaming itself as Acer Incorporated. After
the merger, the principal activities of the Company focus on globally marketing its brand-name IT products, and
promoting E-commerce solutions to clients.
The Company completed the acquisition of 100% equity ownership of Gateway, Inc. (including eMachines
brand), a personal computer company in the U.S., through its indirectly wholly owned subsidiary on October
15, 2007. The Company also acquired the 100% equity ownership of Packard Bell B.V., a personal computer
company in Europe, through its indirectly wholly owned subsidiary on March 14, 2008 and June 30, 2008.
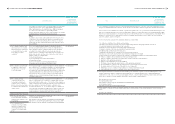
Following the acquisitions of Gateway and Packard Bell, the Company has dened a clear path for its multi-
brand strategy. Additionally, on September 1, 2008, the Company entered the smart phone market following
the acquisition of E-Ten Information Systems Co., Ltd. In October 2010, in order to expand into the market in
China, the Company acquired the PC business, management team and employees, regional sales and marketing
channels of Founder Technology Group Corporation, through its indirectly wholly owned subsidiary.
The reporting entities of the consolidated financial statements include the Company and its subsidiaries
(hereinafter referred to collectively as the “Consolidated Companies”). On December 31, 2009 and 2010, the
number of employees of the Consolidated Companies was 7,757 and 6,624, respectively. The Consolidated
Companies are summarized below according to their primary business activity.
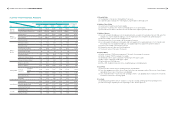
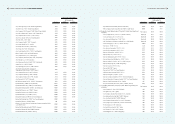
(1) Sale of “Acer”, “Gateway”, “eMachines”, “Packard Bell” and “Founder” brand-name information technology
products:
Percentage of Ownership
At December 31,
Investor 2009 2010
(a) Acer Incorporated
(b) Acer Greater China (B.V.I.) Corp. (“AGC”, British Virgin Islands) and
subsidiaries The Company 100.00 100.00
.Acer Market Services Limited (“AMS”, Hong Kong) AGC 100.00 100.00
.Acer Computer (Far East) Limited (“AFE”, Hong Kong) AGC 100.00 100.00
.Acer Information (Zhong Shan) Co., Ltd. (“AIZS”, China) AMS 100.00 100.00
.Beijing Acer Information Co., Ltd. (“BJAI”, China) AMS 100.00 100.00
.Acer Computer (Shanghai) Ltd. (“ACCN”, China) AMS 100.00 100.00
.Acer (Chongqing) Ltd. (“ACCQ”, China) AMS - 100.00
(c) Acer European Holding B.V. (“AEH”, Netherlands Antilles ) and subsidiaries The Company 100.00 100.00
.Acer Europe B.V. (“AHN”, the Netherlands) AEH 100.00 100.00
.Acer Computer B.V. (“ACH”, the Netherlands) AEH 100.00 100.00