Acer 2010 Annual Report Download - page 66
Download and view the complete annual report
Please find page 66 of the 2010 Acer annual report below. You can navigate through the pages in the report by either clicking on the pages listed below, or by using the keyword search tool below to find specific information within the annual report.-
 1
1 -
2
-
3
-
4
-
5
-
6
-
7
-
8
-
9
-
10
-
11
-
12
-
13
-
14
-
15
-
16
-
17
-
18
-
19
-
20
-
21
-
22
-
23
-
24
-
25
-
26
-
27
-
28
-
29
-
30
-
31
-
32
-
33
-
34
-
35
-
36
-
37
-
38
-
39
-
40
-
41
-
42
-
43
-
44
-
45
-
46
-
47
-
48
-
49
-
50
-
51
-
52
-
53
-
54
-
55
-
 56
56 -
 57
57 -
 58
58 -
 59
59 -
 60
60 -
 61
61 -
 62
62 -
 63
63 -
 64
64 -
 65
65 -
 66
66 -
 67
67 -
 68
68 -
 69
69 -
 70
70 -
 71
71
 |
 |

ACER INCORPORATED
2010 ANNUAL REPORT
128
FINANCIAL STANDING
129
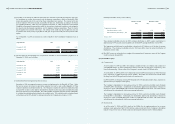
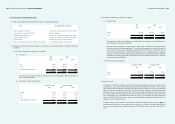
7.5 Disclosure of the Impact on Company’s Financial Status Due to
Financial Difficulties
Not applicable.
7.6 Financial Prediction and Achievements
7.6.1 Financial Forecast of Year 2011:
Not applicable.
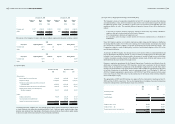
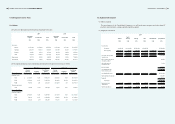
2010
Taiwan
North
America Europe Asia Eliminations Consolidated
NT$ NT$ NT$ NT$ NT$ NT$
Area income:
Customers 41,343,033 151,314,401 296,425,417 142,619,456 - 631,702,307
Inter-company 433,752,764 9,028 8,994,859 83,553 (442,840,204) -
475,095,797 151,323,429 305,420,276 142,703,009 (442,840,204) 631,702,307
Area prot (loss) before
income taxes
446,907,391 (2,853,206) 12,897,125 3,498,712 (442,840,204) 17,609,818
Net investment income by
the equity method
375,948
Gain on disposal of
investments, net
2,376,407
Interest expense (1,032,786)
Consolidated income
before income taxes
19,329,387
Area identiable assets 146,909,644 47,590,583 85,557,881 42,071,003 (64,343,753) 257,785,358
Equity method investments 2,235,701
Goodwill 20,477,471
Total assets 280,498,530
Depreciation and
amortization
1,109,796 469,272 754,494 262,042 -2,595,604
Capital expenditures 692,911 41,684 316,665 62,134 - 1,113,394
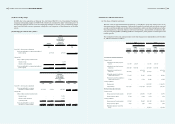
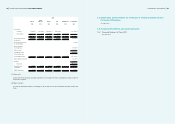
(3) Export sales
Export sales of the domestic operating segments do not exceed 10% of the consolidated revenues, hence no
disclosure is required.
(4) Major customers
No sales to individual customers accounting for more than 10% of the consolidated revenues in 2009 and
2010.