Acer 2010 Annual Report Download - page 38
Download and view the complete annual report
Please find page 38 of the 2010 Acer annual report below. You can navigate through the pages in the report by either clicking on the pages listed below, or by using the keyword search tool below to find specific information within the annual report.-
 1
1 -
2
-
3
-
4
-
5
-
6
-
7
-
8
-
9
-
10
-
11
-
12
-
13
-
14
-
15
-
16
-
17
-
18
-
19
-
20
-
21
-
22
-
23
-
24
-
25
-
26
-
27
-
 28
28 -
 29
29 -
 30
30 -
 31
31 -
 32
32 -
 33
33 -
 34
34 -
 35
35 -
 36
36 -
 37
37 -
 38
38 -
 39
39 -
 40
40 -
 41
41 -
 42
42 -
 43
43 -
 44
44 -
 45
45 -
 46
46 -
 47
47 -
 48
48 -
49
-
50
-
51
-
52
-
53
-
54
-
55
-
56
-
57
-
58
-
59
-
60
-
61
-
62
-
63
-
64
-
65
-
66
-
67
-
68
-
69
-
70
-
71
 |
 |

ACER INCORPORATED
2010 ANNUAL REPORT
72
FINANCIAL STANDING
73
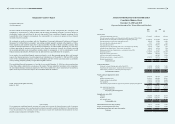
Independent Auditors’ Report
The Board of Directors
Acer Incorporated:
We have audited the accompanying consolidated balance sheets of Acer Incorporated (the “Company”) and
subsidiaries as of December 31, 2010 and 2009, and the related consolidated statements of income, changes in
stockholders’ equity, and cash flows for the years then ended. These consolidated financial statements are the
responsibility of the Company’s management. Our responsibility is to express an opinion on these financial
statements based on our audits.
We conducted our audits in accordance with the “Regulations Governing Auditing and Certication of Financial
Statements by Certied Public Accountants” and auditing standards generally accepted in the Republic of China.
Those regulations and standards require that we plan and perform the audit to obtain reasonable assurance about
whether the nancial statements are free of material misstatement. An audit includes examining, on a test basis,
evidence supporting the amounts and disclosures in the financial statements. An audit also includes assessing
the accounting principles used and signicant estimates made by management, as well as evaluating the overall
nancial statement presentation. We believe that our audits provide a reasonable basis for our opinion.
In our opinion, the consolidated nancial statements referred to in the rst paragraph present fairly, in all material
respects, the nancial position of Acer Incorporated and subsidiaries as of December 31, 2010 and 2009, and the
results of their consolidated operations and their consolidated cash ows for the years then ended, in conformity
with accounting principles generally accepted in the Republic of China.
The consolidated nancial statements as of and for the year ended December 31, 2010, have been translated into
United States dollars solely for the convenience of the readers. We have audited the translation, and in our opinion,
the consolidated financial statements expressed in New Taiwan dollars have been translated into United States
dollars on the basis set forth in note 2(27) to the consolidated nancial statements.
Taipei, Taiwan (the Republic of China)
March 11, 2011
Note to Readers
The accompanying consolidated nancial statements are intended only to present the nancial position, results of operations
and cash ows in accordance with accounting principles and practices generally accepted in the Republic of China and not those
of any other jurisdictions. The standards, procedures and practices to audit such consolidated financial statements are those
generally accepted and applied in the Republic of China.
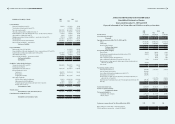
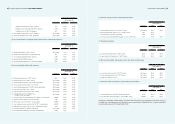
ACER INCORPORATED AND SUBSIDIARIES
Consolidated Balance Sheets
December 31, 2009 and 2010
(Expressed in thousands of New Taiwan dollars and US dollars)
Assets 2009 2010
NT$ NT$ US$
Current assets:
Cash and cash equivalents (note 4(1)) 53,616,067 68,456,386 2,350,030
Notes and accounts receivable, net of allowance for doubtful accounts of NT$1,681,844
and NT$1,159,472 as of December 31, 2009 and 2010, respectively (note 4(2)) 111,858,366 101,730,888 3,492,306
Notes and accounts receivables from related parties (note 5) 600,306 719,024 24,683
Other receivables from related parties (note 5) 21,507 46,914 1,611
Other receivables (note 4(3)) 9,263,152 7,860,935 269,857
Financial assets at fair value through prot or loss ‒ current (notes 4(5) and (25)) 157,659 38,895 1,335
Available-for-sale nancial assets ‒ current (notes 4(4) and (25)) 223,437 225,710 7,748
Hedging purpose derivative nancial assets ‒ current (notes 4(6) and (25)) 1,275,157 88,372 3,034
Inventories (note 4(7)) 51,184,953 41,240,053 1,415,724
Prepayments and other current assets 1,694,058 1,845,878 63,367
Non-current assets held for sale (note 4(8)) - 1,827,855 62,748
Deferred income tax assets ‒ current (note 4(20)) 2,213,215 1,655,718 56,839
Restricted deposits (note 6) - 24,197 831
Total current assets 232,107,877 225,760,825 7,750,113
Long-term investments:
Investments accounted for using equity method (note 4(10)) 3,314,950 2,235,701 76,749
Available-for-sale nancial assets ‒ noncurrent (notes 4(11) and (25)) 3,306,742 2,274,902 78,095
Financial assets carried at cost ‒ noncurrent (notes 4(9) and (25)) 2,251,058 1,722,677 59,138
Total long-term investments 8,872,750 6,233,280 213,982
Property, plant and equipment (note 4(12)):
Land 2,509,029 1,927,170 66,158
Buildings and improvements 5,386,921 4,629,090 158,911
Computer equipment and machinery 3,059,222 3,102,280 106,498
Other equipment 3,219,265 3,152,324 108,216
Construction in progress and advance payments for purchases of property and equipment 83,680 50,993 1,751
14,258,117 12,861,857 441,534
Less: accumulated depreciation (4,904,235) (5,040,515) (173,035)
accumulated impairment (677,709) (881,568) (30,263)
Net property, plant and equipment 8,676,173 6,939,774 238,236
Intangible assets (note 4(14))
Trademark 7,862,465 10,043,300 344,775
Goodwill 21,977,454 20,477,471 702,968
Other intangible assets 5,604,149 5,872,164 201,585
Total intangible assets 35,444,068 36,392,935 1,249,328
Other nancial assets (notes 4(15), (25) and 6) 789,711 1,038,501 35,651
Property not used in operation (note 4(13)) 2,971,542 2,355,522 80,862
Deferred charges and other assets (notes 4(19) and (20)) 2,162,567 1,777,693 61,026
Total assets 291,024,688 280,498,530 9,629,198