Acer 2010 Annual Report Download - page 35
Download and view the complete annual report
Please find page 35 of the 2010 Acer annual report below. You can navigate through the pages in the report by either clicking on the pages listed below, or by using the keyword search tool below to find specific information within the annual report.-
 1
1 -
2
-
3
-
4
-
5
-
6
-
7
-
8
-
9
-
10
-
11
-
12
-
13
-
14
-
15
-
16
-
17
-
18
-
19
-
20
-
21
-
22
-
23
-
24
-
 25
25 -
 26
26 -
 27
27 -
 28
28 -
 29
29 -
 30
30 -
 31
31 -
 32
32 -
 33
33 -
 34
34 -
 35
35 -
 36
36 -
 37
37 -
 38
38 -
 39
39 -
 40
40 -
 41
41 -
 42
42 -
 43
43 -
 44
44 -
 45
45 -
46
-
47
-
48
-
49
-
50
-
51
-
52
-
53
-
54
-
55
-
56
-
57
-
58
-
59
-
60
-
61
-
62
-
63
-
64
-
65
-
66
-
67
-
68
-
69
-
70
-
71
 |
 |

ACER INCORPORATED
2010 ANNUAL REPORT
66
FINANCIAL STANDING
67
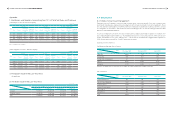
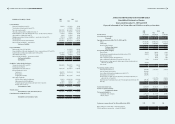
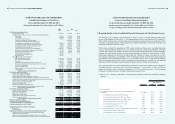
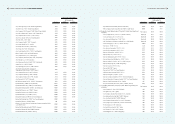
7.1 Five-Year Consolidated Financial Information
7.1.1 Five-Year Balance Sheet
As of March 31, 2011
Unit: NT$ Thousand
Period
Item
Most Recent 5-Year Financial Information Current year
as of Mar. 31
,2011
2006 2007 2008 2009 2010
Current assets 161,267,661 191,626,201 186,390,592 232,107,877 225,760,825 213,484,707
Fund and Long-term equity
investments 13,835,538 11,202,652 6,773,547 8,872,750 6,233,280 6,196,104
Net property, plant and
equipment 6,190,501 8,636,441 9,336,221 8,676,173 6,939,774 6,943,373
Intangible assets 396,682 25,926,493 34,746,765 35,444,068 36,392,935 36,301,861
Other assets 6,809,916 5,891,555 6,195,100 5,923,820 5,171,716 5,383,549
Total assets 188,500,298 243,283,342 243,442,225 291,024,688 280,498,530 268,309,595
Current
Liabilities
Before
Distribution 109,970,460 142,842,574 149,315,158 179,846,517 162,558,924 146,967,400
After
Distribution 119,487,678 152,163,698 154,601,124 188,183,352 Un-appropriated Un-appropriated
Long-term liabilities 168,627 16,790,876 4,134,920 12,371,856 20,666,296 21,071,651
Other liabilities 2,805,428 6,240,899 7,114,532 5,928,652 3,164,937 3,460,831
Total Liabilities
Before
Distribution 112,944,515 165,874,348 160,564,610 198,147,026 186,390,156 171,499,882
After
Distribution 122,461,733 175,195,472 165,850,575 206,483,861 Un-appropriated Un-appropriated
Common stock 23,370,637 24,054,904 26,428,560 26,882,283 27,023,449 27,085,679
Capital surplus 29,947,020 29,898,982 37,129,952 38,494,118 39,578,915 39,673,304
Retained
Earnings
Before
Distribution 18,284,265 21,041,713 22,771,901 28,575,011 35,329,280 36,514,170
After
Distribution 8,767,047 11,720,589 17,485,935 20,238,176 Un-appropriated Un-appropriated
Unrealized Gain (loss) on
Financial assets 4,361,608 2,524,500 (1,729,631) 1,014,317 460,600 95,600
Translation adjustments 1,335,500 2,733,899 1,241,058 959,621 (5,095,919) (3,380,767)
Minimum Pension Liability
adjustment 0 (173,364) (283) (7,908) (23,957) (17,926)
Treasury Stock (3,270,920) (3,270,920) (3,522,598) (3,522,598) (3,522,598) (3,522,598)
Minority Interest 1,527,674 599,280 558,656 482,818 358,604 362,251
Stockholders’
Equity
Before
Distribution 75,555,783 77,408,994 82,877,615 92,877,662 94,108,374 96,809,713
After
Distribution 66,038,565 68,087,869 77,591,648 84,540,827 Un-appropriated Un-appropriated
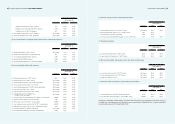
7.1.2 Five-Year Consolidated Income Statement
Unit: NT$ Thousand
Period
Item
Most Recent 5-Year Financial Information Current year
as of Mar. 31
,2011
2006 2007 2008 2009 2010
Operating revenue 350,816,353 462,066,080 546,274,115 573,982,544 629,058,973 127,798,935
Gross profit 38,171,313 47,418,310 57,285,660 58,327,860 64,481,268 13,212,704
Operating (loss) income 7,462,446 10,185,123 14,072,302 15,339,466 18,203,913 1,928,852
Non-operating Income and Gain 9,266,120 6,699,671 5,353,038 1,719,037 4,321,397 345,524
Non-operating Expense and Loss 3,180,259 1,776,157 4,618,613 2,075,520 3,195,923 780,755
Continuing operating income before
tax 13,548,307 15,108,637 14,806,728 14,982,983 19,329,387 1,493,621
Income(Loss) from Discontinuned
segment 0 517,866 99,843 0 0 0
Extraordiniary Items 0 0 0 0 0 0
Cumulative Effect of changes in
accounting principle 0 0 0 0 0 0
Income after income taxes 10,218,242 12,958,933 11,742,135 11,353,374 15,117,997 1,184,890
EPS 4.16 5.27 4.67 4.31 5.71 0.45
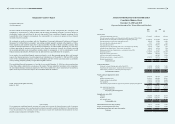
7.1.3 CPAs’ and Auditors’ Opinions:
Year Name of CPA(s) Auditors’ Opinion
2006 Winston Yu, Albert Lou Modified unreserved
2007 Sonia Chang, Winston Yu Unreserved
2008 Sonia Chang, Agnes Yang Modified unreserved
2009 Sonia Chang, Agnes Yang Unreserved
2010 Sonia Chang, Agnes Yang Unreserved