Acer 2010 Annual Report Download - page 48
Download and view the complete annual report
Please find page 48 of the 2010 Acer annual report below. You can navigate through the pages in the report by either clicking on the pages listed below, or by using the keyword search tool below to find specific information within the annual report.-
 1
1 -
2
-
3
-
4
-
5
-
6
-
7
-
8
-
9
-
10
-
11
-
12
-
13
-
14
-
15
-
16
-
17
-
18
-
19
-
20
-
21
-
22
-
23
-
24
-
25
-
26
-
27
-
28
-
29
-
30
-
31
-
32
-
33
-
34
-
35
-
36
-
37
-
 38
38 -
 39
39 -
 40
40 -
 41
41 -
 42
42 -
 43
43 -
 44
44 -
 45
45 -
 46
46 -
 47
47 -
 48
48 -
 49
49 -
 50
50 -
 51
51 -
 52
52 -
 53
53 -
 54
54 -
 55
55 -
 56
56 -
 57
57 -
 58
58 -
59
-
60
-
61
-
62
-
63
-
64
-
65
-
66
-
67
-
68
-
69
-
70
-
71
 |
 |

ACER INCORPORATED
2010 ANNUAL REPORT
92
FINANCIAL STANDING
93
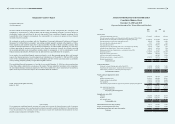
4. Signicant Account Disclosures
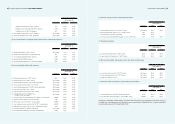
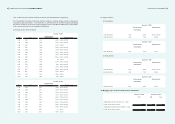
(1) Cash and cash equivalents
December 31, 2009 December 31, 2010
NT$ NT$ US$
Cash on hand 8,217 18,805 646
Bank deposits 34,278,393 48,641,345 1,669,802
Time deposits 19,329,457 19,796,236 679,582
53,616,067 68,456,386 2,350,030
(2) Notes and accounts receivable
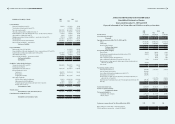
The Consolidated Companies entered into factoring contracts with several banks to sell part of accounts
receivable without recourse. As of December 31, 2009 and 2010, details of these contracts were as follows:
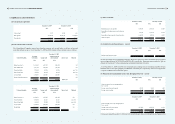
December 31, 2009
Underwriting bank
Factoring
credit limit Amount sold
Amount advanced
(derecognized)
Interest rate
Collateral
NT$ NT$ NT$
Italia Factor S.p.A. 11,219,842 6,877,785 2,091,300 Nil
ABN AMRO Bank 7,881,189 3,480,028 3,227,242 Nil
China Trust Bank 1,750,000 218,706 218,706 note 7(4)
Taipei Fubon Bank 968,500 442,145 442,145 note 7(4)
La Caixa Bank 3,724,657 3,200,041 3,200,041 Nil
Emirates Bank International 960,900 - - Nil
26,505,088 14,218,705 9,179,434 0.83%~5%
December 31, 2010
Underwriting bank
Factoring
credit limit Amount sold
Amount advanced
(derecognized)
Interest rate
Collateral
NT$ NT$ NT$
Italia Factor S.p.A. 10,650,633 3,615,597 3,461,056 Nil
China Trust Bank 1,000,000 227,217 227,217 note 7(4)
Taipei Fubon Bank 600,000 398,989 398,989 note 7(4)
La Caixa Bank 5,698,038 5,569,479 5,049,844 Nil
Taishin Bank 22,261,932 8,184,158 8,168,602 Nil
40,210,603 17,995,440 17,305,708 0.84%~5%
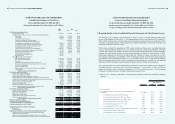
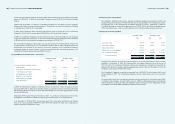
(3) Other receivable
December 31, 2009 December 31, 2010
NT$ NT$ US$
Refundable income tax and VAT 1,690,263 2,465,753 84,647
Receivables of reimbursement of advertisement
expense
917,452 1,553,181 53,319
Receivables of patent royalty allocated to others 1,164,992 422,769 14,513
Other receivables 5,490,445 3,419,232 117,378
9,263,152 7,860,935 269,857
(4) Available-for-sale nancial assets-current
December 31, 2009 December 31, 2010
NT$ NT$ US$
Publicly traded equity securities 223,437 225,710 7,748
In 2009 and 2010, the Consolidated Companies disposed of portions of these investments and recognized
gains on disposal thereof of NT$24,022 and NT$16,545, respectively. These gains were recorded as “gain on
disposal of investments” in the accompanying consolidated statements of income.
As of December 31, 2009 and 2010, the unrealized gain resulting from re-measuring available-for-sale
nancial assets to fair value amounted to NT$92,843 and NT$96,717, respectively, which was recognized as
a separate component of stockholders’ equity.
(5) Financial assets and liabilities at fair value through prot or loss-current
December 31, 2009 December 31, 2010
NT$ NT$ US$
Financial assets at fair value through prot or
loss-current:
Foreign currency forward contracts 139,515 30,381 1,043
Foreign currency options 18,144 8,514 292
157,659 38,895 1,335
December 31, 2009 December 31, 2010
NT$ NT$ US$
Financial liability at fair value through prot or
loss-current:
Foreign currency forward contracts (157,848) (289,276) (9,931)
Foreign currency options (4,691) (9,722) (333)
(162,539) (298,998) (10,264)
For the years ended December 31, 2009 and 2010, unrealized gains (losses) resulting from the changes in fair