Acer 2010 Annual Report Download - page 39
Download and view the complete annual report
Please find page 39 of the 2010 Acer annual report below. You can navigate through the pages in the report by either clicking on the pages listed below, or by using the keyword search tool below to find specific information within the annual report.-
 1
1 -
2
-
3
-
4
-
5
-
6
-
7
-
8
-
9
-
10
-
11
-
12
-
13
-
14
-
15
-
16
-
17
-
18
-
19
-
20
-
21
-
22
-
23
-
24
-
25
-
26
-
27
-
28
-
 29
29 -
 30
30 -
 31
31 -
 32
32 -
 33
33 -
 34
34 -
 35
35 -
 36
36 -
 37
37 -
 38
38 -
 39
39 -
 40
40 -
 41
41 -
 42
42 -
 43
43 -
 44
44 -
 45
45 -
 46
46 -
 47
47 -
 48
48 -
 49
49 -
50
-
51
-
52
-
53
-
54
-
55
-
56
-
57
-
58
-
59
-
60
-
61
-
62
-
63
-
64
-
65
-
66
-
67
-
68
-
69
-
70
-
71
 |
 |

ACER INCORPORATED
2010 ANNUAL REPORT
74
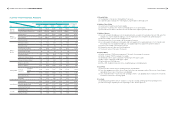
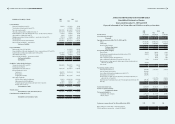
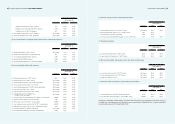
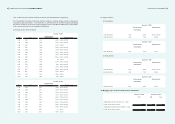
FINANCIAL STANDING
75
Liabilities and Stockholders’ Equity 2009 2010
NT$ NT$ US$
Current liabilities:
Short-term borrowings (note 4(16)) 548,059 1,651,630 56,699
Current portion of long-term debt (note 4(18)) - 6,100,000 209,406
Notes and accounts payable 95,831,720 84,234,625 2,891,680
Notes and accounts payable to related parties (note 5) 10,232,364 7,766,098 266,602
Financial liabilities at fair value through prot or loss ‒ current (notes 4(5) and (25)) 162,539 298,998 10,264
Other payables to related parties (note 5) 92,187 537,267 18,444
Hedging purpose derivative nancial liabilities ‒ current (notes 4(6) and (25)) 196,714 759,866 26,085
Royalties payable 16,337,817 10,501,921 360,519
Accrued expenses and other current liabilities 55,764,403 50,129,779 1,720,899
Deferred income tax liabilities ‒ current 4(20)) 680,714 578,740 19,867
Total current liabilities 179,846,517 162,558,924 5,580,465
Long-term liabilities:
Bonds payable (notes 4(17) and, (25)) - 13,103,887 449,842
Financial liabilities at fair value through prot or loss ‒ noncurrent (notes 4(17) and (25)) - 1,338,524 45,950
Long-term debt, excluding current portion (notes 4(18) and (25)) 12,371,856 6,221,933 213,592
Other liabilities (note 4(19)) 384,706 330,662 11,351
Deferred income tax liabilities ‒ noncurrent (note 4(20)) 5,543,947 2,836,226 97,364
Total long-term liabilities 18,300,509 23,831,232 818,099
Total liabilities 198,147,026 186,390,156 6,398,564
Stockholders’ equity and minority interest:
Common stock (notes 4(21) and (22)) 26,882,283 27,001,793 926,941
Common stock subscribed - 21,656 743
Capital surplus (notes 4(10) and (21)) 38,494,118 39,578,915 1,358,699
Retained earnings (note 4(21)):
Legal reserve 9,960,796 11,096,134 380,918
Special reserve 1,991,615 - -
Unappropriated earnings 16,622,600 24,233,146 831,897
Other equity components:
Foreign currency translation adjustment 959,621 (5,095,919) (174,937)
Minimum pension liability adjustment (7,908) (23,957) (822)
Unrealized gain on nancial instruments (notes 4(4), (6) and (11)) 1,014,317 460,600 15,812
Treasury stock (note 4(21)) (3,522,598) (3,522,598) (120,927)
Total stockholders’ equity 92,394,844 93,749,770 3,218,324
Minority interest 482,818 358,604 12,310
Total stockholders’ equity and minority interest 92,877,662 94,108,374 3,230,634
Commitments and contingencies (note 7)
Total liabilities and stockholders’ equity 291,024,688 280,498,530 9,629,198
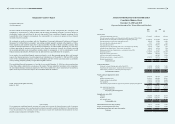
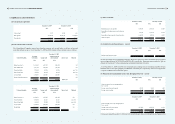
ACER INCORPORATED AND SUBSIDIARIES
Consolidated Statements of Income
Years ended December 31, 2009 and 2010
(Expressed in thousands of New Taiwan dollars and US dollars, except for per share data)
2009 2010
NT$ NT$ US$
Net sales (note 5) 573,982,544 629,058,973 21,594,884
Cost of sales (notes 4(7) and 5) (515,654,684) (564,577,705) (19,381,315)
Gross prot 58,327,860 64,481,268 2,213,569
Operating expenses (notes 4(14), (19), (21), (22), 5 and 10):
Selling (35,729,296) (38,982,174) (1,338,214)
Administrative (6,372,585) (6,084,942) (208,889)
Research and development (886,513) (1,210,239) (41,546)
Total operating expenses (42,988,394) (46,277,355) (1,588,649)
Operating income 15,339,466 18,203,913 624,920
Non-operating income and gains:
Interest income 361,656 308,036 10,574
Investment gain recognized using equity method, net (note 4(10)) 400,098 375,948 12,906
Other investment income - 30,085 1,033
Gain on disposal of property and equipment, net - 82,974 2,848
Gain on disposal of investments, net (notes 4(4), (9), (10), (11)) 79,162 2,376,407 81,579
Foreign currency exchange gain and valuation gain on nancial instruments, net
(notes 4(5), (6) and (25)) 473,648 - -
Other income 404,473 1,147,947 39,408
1,719,037 4,321,397 148,348
Non-operating expenses and loss:
Interest expense (note 4(17)) (622,080) (1,032,786) (35,455)
Other investment loss (note 4(9)) (231,934) - -
Loss on disposal of property and equipment, net (note 4(12)) (103,055) - -
Restructuring cost (note 4(23)) (164,595) - -
Foreign currency exchange loss and valuation loss on nancial instruments, net
(notes 4(5), (6), (17) and (25)) - (1,311,734) (45,030)
Impairment loss of non-nancial assets, net of reversal gain (notes 4(12) and (13)) (395,109) (378,178) (12,982)
Other loss (558,747) (473,225) (16,245)
(2,075,520) (3,195,923) (109,712)
Income before income taxes 14,982,983 19,329,387 663,556
Income tax expense (note 4(20)) (3,630,123) (4,211,247) (144,567)
Consolidated net income 11,352,860 15,118,140 518,989
Net income attributable to:
Shareholders of the Company 11,353,374 15,117,997 518,984
Minority interest (514) 143 5
11,352,860 15,118,140 518,989
Earnings per common share (in New Taiwan dollars) (note 4(24)): NT$ NT$ US$
Basic earnings per common share ‒ retroactively adjusted 4.31 5.71 0.20
Diluted earnings per common share ‒ retroactively adjusted 4.25 5.57 0.19