Acer 2010 Annual Report Download - page 65
Download and view the complete annual report
Please find page 65 of the 2010 Acer annual report below. You can navigate through the pages in the report by either clicking on the pages listed below, or by using the keyword search tool below to find specific information within the annual report.-
 1
1 -
2
-
3
-
4
-
5
-
6
-
7
-
8
-
9
-
10
-
11
-
12
-
13
-
14
-
15
-
16
-
17
-
18
-
19
-
20
-
21
-
22
-
23
-
24
-
25
-
26
-
27
-
28
-
29
-
30
-
31
-
32
-
33
-
34
-
35
-
36
-
37
-
38
-
39
-
40
-
41
-
42
-
43
-
44
-
45
-
46
-
47
-
48
-
49
-
50
-
51
-
52
-
53
-
54
-
 55
55 -
 56
56 -
 57
57 -
 58
58 -
 59
59 -
 60
60 -
 61
61 -
 62
62 -
 63
63 -
 64
64 -
 65
65 -
 66
66 -
 67
67 -
 68
68 -
 69
69 -
 70
70 -
 71
71
 |
 |

ACER INCORPORATED
2010 ANNUAL REPORT
126
FINANCIAL STANDING
127
9. Subsequent Events: None
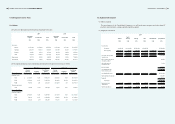
10. Others
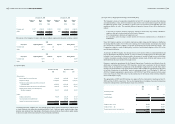
(1) Labor cost, depreciation and amortization categorized by function
2009 2010
Operating
expense Cost of sales
Total
Operating
expense Cost of sales
Total
NT$ NT$ NT$ NT$ NT$ NT$
Labor cost:
Salaries 10,691,422 2,203,906 12,895,328 13,133,144 2,073,441 15,206,585
Insurance 1,103,299 202,810 1,306,109 1,191,827 165,214 1,357,041
Pension 438,401 25,293 463,694 483,702 24,658 508,360
Other 927,649 104,031 1,031,680 755,314 134,868 890,182
Depreciation 797,215 49,088 846,303 648,953 55,533 704,486
Amortization 1,847,624 12,660 1,860,284 1,609,831 281,287 1,891,118
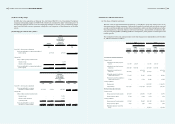
(2) The signicant nancial assets and liabilities denominated in foreign currencies were as follows:
2009.12.31 2010.12.31
Financial assets
Foreign
Currency
(in thousands)
Exchange
Rate
New Taiwan
dollars
(in thousands)
Foreign
Currency
(in thousands)
Exchange
Rate
New Taiwan
dollars
(in thousands)
Monetary assets
USD $ 2,165,436 32.03 69,358,915 2,552,262 29.13 74,347,392
EUR 1,557,832 45.87 71,457,754 1,833,495 38.9876 71,483,570
RMB 983,054 4.69 4,610,523 3,014,289 4.41 13,293,014
Non-monetary assets
USD 83,450 32.03 2,672,904 33,658 29.13 980,458
Financial liabilities
Monetary liabilities
USD 2,967,829 32.03 95,059,563 3,817,104 29.13 111,192,240
EUR 394,341 45.87 18,088,422 403,863 38.9876 15,745,649
RMB 337,244 4.69 1,581,674 810,156 4.41 3,572,788
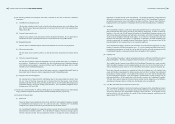
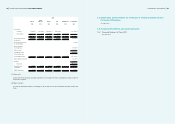
11. Segment Information
(1) Industry segment
The main business of the Consolidated Companies is to sell brand-name computers and other related IT
products, which represents a single reportable operating segment.
(2) Geographic information
2009
Taiwan
North
America Europe Asia Eliminations Consolidated
NT$ NT$ NT$ NT$ NT$ NT$
Area income:
Customers 32,460,389 149,934,829 287,063,526 106,047,556 - 575,506,300
Inter-company 404,809,061 187,495 6,404,956 7,297 (411,408,809) -
437,269,450 150,122,324 293,468,482 106,054,853 (411,408,809) 575,506,300
Area prot (loss) before
income taxes
415,341,104 (3,051,275) 10,755,265 3,489,518 (411,408,809) 15,125,803
Net investment income by
the equity method
400,098
Gain on disposal of
investments, net
79,162
Interest expense (622,080)
Consolidated income
before income taxes
14,982,983
Area identiable assets 154,584,475 68,774,280 106,947,852 32,809,119 (97,383,442) 265,732,284
Equity method investments 3,314,950
Goodwill 21,977,454
Total assets 291,024,688
Depreciation and
amortization
1,064,578 667,269 847,796 126,944 -2,706,587
Capital expenditures 413,968 30,381 243,081 84,145 -771,575