Acer 2010 Annual Report Download - page 61
Download and view the complete annual report
Please find page 61 of the 2010 Acer annual report below. You can navigate through the pages in the report by either clicking on the pages listed below, or by using the keyword search tool below to find specific information within the annual report.-
 1
1 -
2
-
3
-
4
-
5
-
6
-
7
-
8
-
9
-
10
-
11
-
12
-
13
-
14
-
15
-
16
-
17
-
18
-
19
-
20
-
21
-
22
-
23
-
24
-
25
-
26
-
27
-
28
-
29
-
30
-
31
-
32
-
33
-
34
-
35
-
36
-
37
-
38
-
39
-
40
-
41
-
42
-
43
-
44
-
45
-
46
-
47
-
48
-
49
-
50
-
 51
51 -
 52
52 -
 53
53 -
 54
54 -
 55
55 -
 56
56 -
 57
57 -
 58
58 -
 59
59 -
 60
60 -
 61
61 -
 62
62 -
 63
63 -
 64
64 -
 65
65 -
 66
66 -
 67
67 -
 68
68 -
 69
69 -
 70
70 -
 71
71
 |
 |

ACER INCORPORATED
2010 ANNUAL REPORT
118
FINANCIAL STANDING
119
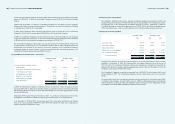
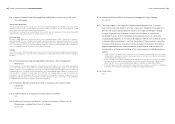
(23) Restructuring charges
In 2009, due to the acquisition of Gateway Inc. and Packard Bell B.V., the Consolidated Companies
recognized restructuring charges of NT$164,595, which were accounted for under “restructuring cost” of
non-operating expenses and loss in the accompanying statements of income. These restructuring charges
were associated with severance payments to employees and integration of the information technology
system.
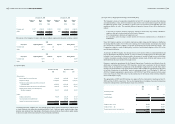
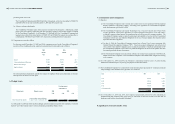
(24) Earnings per common share (“EPS”)
2009
Amount
(in thousands)
Weighted-
average number
of outstanding
shares of
common stock
(in thousands)
EPS (in dollars)
NT$ NT$
Basic EPS-after retroactive adjustments
Net income attributable to common shareholders of
parent company
11,353,374
2,635,011 4.31
Diluted EPS
Effect of dilutive potential common shares:
Employee bonus - 23,175
Employee stock option plan - 10,953
Net income attributable to common shareholders of
parent company
11,353,374 2,669,139 4.25
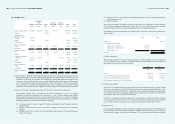
2010
Amount (in thousands)
Weighted-
average number
of outstanding
shares of common
stock
(in thousands) EPS (in dollars)
NT$ US$ NT$ US$
Basic EPS-after retroactive adjustments
Net income attributable to common
shareholders of parent company 15,117,997 518,984 2,647,466 5.71 0.20
Diluted EPS
Effect of dilutive potential common shares:
Employee bonus - - 23,328
Employee stock option plan - - 17,153
Convertible bonds 171,597 5,891 56,052
Net income attributable to common
shareholders of parent company
15,289,594 524,875 2,743,999
5.57
0.19
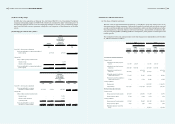
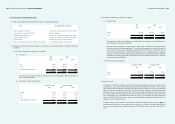
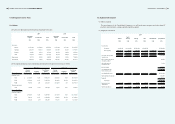
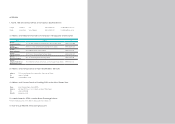
(25) Disclosure of nancial instruments
(a) Fair values of nancial instruments
The book value of short-term financial instruments is considered to be the fair value because of the
short-term maturity of these instruments. Such method is applied to cash and cash equivalents, notes and
accounts receivable (including receivables from related parties), other receivables (including receivables
from related parties), restricted deposits, short-term borrowings, current portion of long-term debt,
notes and accounts payables (including payables to related parties), other payables to related parties and
royalties payable.
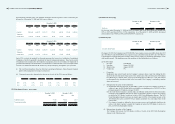
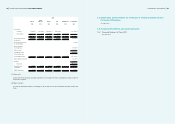
The estimated fair values and carrying amounts of all other nancial assets and liabilities as of December
31, 2009 and 2010 were as follows:
2009 2010
Fair value Fair value
Carrying
amount
Public
quoted
price
Valuation
amount
Carrying
amount
Public
quoted
price
Valuation
amount
NT$ NT$ NT$ NT$ NT$ NT$
Non-derivative nancial instruments
Financial assets:
Available-for-sale nancial assets-
current 223,437 223,437 - 225,710 225,710 -
Available-for-sale nancial assets-
noncurrent 3,306,742 3,306,742 - 2,274,902 2,274,902 -
Financial assets carried at cost-
noncurrent 2,251,058 -
see below
(b) 1,722,677 -
see below
(b)
Refundable deposits (classied as
“other nancial assets”) 771,957 - 771,957 956,241 - 956,241
Noncurrent receivables (classied as
“other nancial assets”) 17,754 - 17,754 82,260 - 82,260
Financial liabilities:
Bonds payable - - - 13,103,887 - 13,668,171
Long-term debt 12,371,856 - 12,371,856 6,221,933 6,221,933
Derivative nancial instruments
Financial assets:
Foreign currency forward contracts 1,414,672 - 1,414,672 118,753 - 118,753
Foreign currency options 18,144 - 18,144 8,514 - 8,514
Financial liabilities:
Foreign currency forward contracts 354,562 - 354,562 1,049,142 - 1,049,142
Foreign currency options 4,691 - 4,691 9,722 - 9,722
Redemption option of convertible
bonds - - - 1,338,524 - 1,338,524