Acer 2010 Annual Report Download - page 26
Download and view the complete annual report
Please find page 26 of the 2010 Acer annual report below. You can navigate through the pages in the report by either clicking on the pages listed below, or by using the keyword search tool below to find specific information within the annual report.-
 1
1 -
2
-
3
-
4
-
5
-
6
-
7
-
8
-
9
-
10
-
11
-
12
-
13
-
14
-
15
-
 16
16 -
 17
17 -
 18
18 -
 19
19 -
 20
20 -
 21
21 -
 22
22 -
 23
23 -
 24
24 -
 25
25 -
 26
26 -
 27
27 -
 28
28 -
 29
29 -
 30
30 -
 31
31 -
 32
32 -
 33
33 -
 34
34 -
 35
35 -
 36
36 -
37
-
38
-
39
-
40
-
41
-
42
-
43
-
44
-
45
-
46
-
47
-
48
-
49
-
50
-
51
-
52
-
53
-
54
-
55
-
56
-
57
-
58
-
59
-
60
-
61
-
62
-
63
-
64
-
65
-
66
-
67
-
68
-
69
-
70
-
71
 |
 |

ACER INCORPORATED
2010 ANNUAL REPORT
48
ACER’S WINNING FORMULA
49
5.4 Employees
5.4.1 Global Human Asset Management
Employees are the Company’s key assets and the main driver of business growth. Acer has fostered a work
environment that empowers employees by entrusting them with the tasks matched to their skill or qualification. There
are clear objectives and reward for achievement, extensive communication and interaction among coworkers, constant
encouragement for innovations, and an effective decision making process. On-the-job training provides the ideal
platform for learning and development.
As a result of employees’ joint effort, Acer has received numerous industry and media recognition. For example, Acer
was voted by Reader’s Digest readers as a “Trusted Brand” in Asia for 12 consecutive years from 1999~2010; in 2007
Forbes selected Acer as one of the “Fabulous 50” – a list of the best of Asia-Pacific’s biggest listed companies. In
2009, Acer became the world’s No. 2 total PC and notebook vendor.
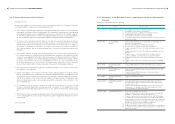
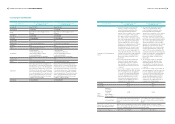
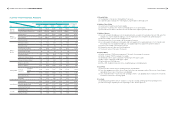
Summary of Acer’s Workforce:
-By Manpower, Age and Years of Service
Date
Category December 2009 December 2010 March 2011
Manpower 6,624 7,757 7,798
Average Age 35.6 36.3 36.3
Average Years of Employment 6.7 5.5 5.5
Male (%) 68.9% 68.0% 67.7%
Female (%) 31.1% 32.0% 32.3%
Remark: The manpower in December 2010 includes the newly-jointed entity, Founder China staff.
-By Job Function
Date
Job Function December 2009 December 2010 March 2011
General Management 164 168 173
Sales & Product Marketing 1,921 3,044 3,046
Customer Service 2,570 2,314 2,330
Research & Development 582 679 698
Sales Support 804 908 908
Administration 583 644 643
Total 6,624 7,757 7,798
Appendix
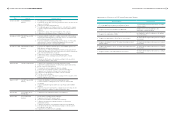
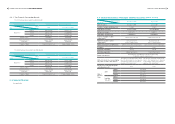
1. Key Buyers and Suppliers Accounting Over 10% of Total Net Sales and Purchase:
(1) Key Buyers for Acer Inc. (Parent Company)
Unit: NT$ Thousand
Item
Year 2009 Year 2010 Current year as of Mar. 31 ,2011
From Amount
Percentage of
total net sales
(%)
Relationship
with Acer Inc. From Amount
Percentage of
total net sales
(%)
Relationship
with Acer Inc. From Amount
Percentage of
total net sales
(%)
Relationship
with Acer Inc.
1 AEG 194,250,207 39.98 (Note 1) AEG 204,939,174 39.29 (Note 1) AEG 30,980,726 30.32 (Note 1)
2 AAC 130,941,632 26.95 (Note 1) AAC 122,612,577 23.51 (Note 1) AAC 24,205,358 23.69 (Note 1)
3 AAPH 60,788,774 12.51 (Note 1) AAPH 72,604,537 13.92 (Note 1) AAPH 18,121,613 17.74 (Note 1)
4 ACCN 10,561,727 10.34 (Note 1)
Note 1: Subsidiary of the Company.
(2) Key Suppliers for Acer Inc. (Parent Company)
Unit: NT$ Thousand
Item
Year 2009 Year 2010 Current year as of Mar. 31 ,2011
From Amount
Percentage
of total net
purchase (%)
Relationship
with Acer
Inc.
From Amount
Percentage
of total net
purchase (%)
Relationship
with Acer
Inc.
From Amount
Percentage
of total net
purchase (%)
Relationship
with Acer
Inc.
1 Supplier A 177,956,728 23.36 none Supplier A 244,408,020 29.81 none Supplier A 44,091,549 30.68 none
2 Supplier B 83,823,914 11.00 none
Others 500,081,566 65.64 Others 575,563,221 70.19 Others 99,637,662 69.32
Total 761,862,208 100.00 Total 819,971,241 100.00 Total 143,729,211 100.00
2. Production Value in the Last Two Years:
Not applicable.
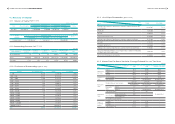
3. The Sales Value in the Last Two Years:
Unit: NT$ Thousand
Year
Major production
2009 2010
Domestic Sales Foreign Sales Domestic Sales Foreign Sales
Computer 13,414,825 392,305,898 12,444,876 409,993,432
Peripherals & Others 58,265,156 21,937,100 13,334,239 85,772,687
Total 71,679,981 414,242,998 25,779,115 495,766,119