Acer 2010 Annual Report Download - page 50
Download and view the complete annual report
Please find page 50 of the 2010 Acer annual report below. You can navigate through the pages in the report by either clicking on the pages listed below, or by using the keyword search tool below to find specific information within the annual report.-
 1
1 -
2
-
3
-
4
-
5
-
6
-
7
-
8
-
9
-
10
-
11
-
12
-
13
-
14
-
15
-
16
-
17
-
18
-
19
-
20
-
21
-
22
-
23
-
24
-
25
-
26
-
27
-
28
-
29
-
30
-
31
-
32
-
33
-
34
-
35
-
36
-
37
-
38
-
39
-
 40
40 -
 41
41 -
 42
42 -
 43
43 -
 44
44 -
 45
45 -
 46
46 -
 47
47 -
 48
48 -
 49
49 -
 50
50 -
 51
51 -
 52
52 -
 53
53 -
 54
54 -
 55
55 -
 56
56 -
 57
57 -
 58
58 -
 59
59 -
 60
60 -
61
-
62
-
63
-
64
-
65
-
66
-
67
-
68
-
69
-
70
-
71
 |
 |

ACER INCORPORATED
2010 ANNUAL REPORT
96
FINANCIAL STANDING
97
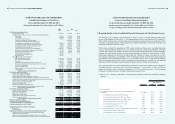
The Consolidated Companies entered into derivative contracts to hedge foreign currency exchange
risk associated with a recognized asset or liability or with a highly probable forecast transaction. As
of December 31, 2009 and 2010, hedged items designated as fair value hedges and fair value of their
respective hedging derivative nancial instruments were as follows:
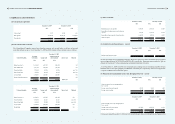
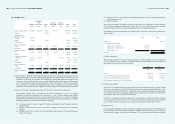
Fair value of hedging instruments
Hedged Items Hedging instruments December 31, 2009 December 31, 2010
NT$ NT$
Accounts receivable/ payable
denominated in foreign currencies
Foreign currency forward
contracts
1,066,045 (638,082)
For the years ended December 31, 2009 and 2010, the unrealized gains (losses) resulting from the changes
in fair value of hedging instruments amounted to NT$641,736 and NT$(1,704,127), respectively.
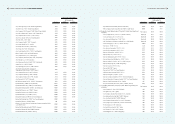
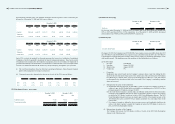
As of December 31, 2009 and 2010, hedged items designated as cash ow hedges and the fair value of
their respective hedging derivative nancial instruments were as follows:
December 31, 2009
Hedged items Hedging instruments
Fair value
of hedging
instruments
Expected period
of cash ow
Expected period
of recognition in
earnings
NT$
Accounts receivable/payable Foreign currency forward 12,398 Jan.~ Mar 2010 Jan.~ Mar 2010
denominated in foreign contracts
currencies
December 31, 2010
Hedged items Hedging instruments
Fair value
of hedging
instruments
Expected period
of cash ow
Expected period
of recognition in
earnings
NT$
Accounts receivable/payable Foreign currency forward (33,412) Jan.~ May 2011 Jan.~ May 2011
denominated in foreign contracts
currencies
As of December 31, 2009 and 2010, unrealized gains (losses) on derivative nancial instruments effective
as cash ow hedges, amounted to NT$12,398 and NT$(33,412), respectively, which were accounted for
as “unrealized gain (loss) on nancial instruments”, a separate component of stockholder’s equity.
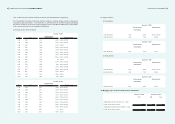
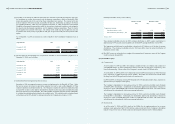
The details of outstanding hedging derivative nancial instruments described above as of December 31,
2009 and 2010 were as follows:
(a) Foreign currency forward contracts
December 31, 2009
Buy Sell Contract amount (in thousands) Maturity period
USD / AUD USD 51,000 2010/01~2010/02
USD / CAD USD 58,265 2010/01~2010/02
USD / EUR EUR 870,918 2010/01~2010/03
EUR / GBP EUR 237,105 2010/01~2010/03
USD / NZD USD 3,900 2010/01~2010/03
AUD / NZD AUD 2,150 2010/01~2010/02
USD / CNY USD 160,000 2010/01~2010/04
USD / NTD USD 25,000 2010/01
December 31, 2010
Buy Sell Contract amount (in thousands) Maturity period
AUD / NZD AUD 4,750 2011/01~2011/05
EUR / GBP EUR 93,133 2011/01~2011/04
EUR / NOK EUR 5,000 2011/01
EUR / SEK EUR 26,646 2011/01
EUR / CHF EUR 11,193 2011/01~2011/02
EUR / PLN EUR 34,832 2011/01~2011/04
USD / CAD USD 133,858 2011/01~2011/03
USD / AUD USD 121,000 2011/01~2011/05
USD / NZD USD 5,250 2011/01~2011/05
USD / NTD USD 21,000 2011/01
USD / EUR EUR 1,024,805 2011/01~2011/03
USD / CNY USD 5,000 2011/01
NOK / EUR EUR 1,023 2011/01
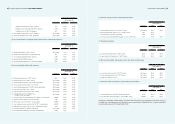
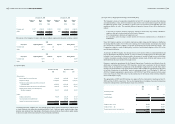
(7) Inventories
(a) Inventories (net of provision for obsolescence and slow-moving inventories) as of December 31, 2009
and 2010, were as follows:
December 31, 2009 December 31, 2010
NT$ NT$ US$
Raw materials 18,489,941 16,422,852 563,778
Work in process 45,089 17,353 595
Finished goods and merchandise 15,471,217 12,150,905 417,127
Spare parts 2,477,522 1,759,398 60,398
Inventories in transit 14,701,184 10,889,545 373,826
51,184,953 41,240,053 1,415,724