Acer 2009 Annual Report Download - page 7
Download and view the complete annual report
Please find page 7 of the 2009 Acer annual report below. You can navigate through the pages in the report by either clicking on the pages listed below, or by using the keyword search tool below to find specific information within the annual report.-
 1
1 -
 2
2 -
 3
3 -
 4
4 -
 5
5 -
 6
6 -
 7
7 -
 8
8 -
 9
9 -
 10
10 -
 11
11 -
 12
12 -
 13
13 -
 14
14 -
 15
15 -
 16
16 -
 17
17 -
 18
18 -
19
-
20
-
21
-
22
-
23
-
24
-
25
-
26
-
27
-
28
-
29
-
30
-
31
-
32
-
33
-
34
-
35
-
36
-
37
-
38
-
39
-
40
-
41
-
42
-
43
-
44
-
45
-
46
-
47
-
48
-
49
-
50
-
51
-
52
-
53
-
54
-
55
-
56
-
57
-
58
-
59
-
60
-
61
-
62
-
63
-
64
-
65
 |
 |

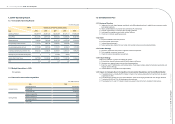
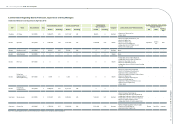
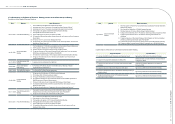
1.2 2009 Operating Report
1.2.1 Consolidated Operating Results
Unit: NT$ Thousand
Period
Item
Most Recent 5-Year Financial Information
2005 2006 2007 2008 2009
Operating Revenue 318,087,679 350,816,353 462,066,080 546,274,115 573,982,544
Gross Prot 34,121,461 38,171,313 47,418,310 57,285,660 58,327,860
Operating Income 7,648,961 7,462,446 10,185,123 14,072,302 15,339,466
Non-operating Income and Gain 7,176,374 9,266,120 6,699,671 5,353,038 1,719,037
Non-operating Expense and Loss 4,172,803 3,180,259 1,776,157 4,618,613 2,075,520
Continuing Operating Income before Tax 10,652,532 13,548,307 15,108,637 14,806,727 14,982,983
Income(Loss) from Discontinued Segment 0 0 517,866 99,843 0
Income after Income Taxes 8,477,502 10,218,242 12,958,933 11,742,135 11,353,374
EPS 3.45 4.16 5.27 4.67 4.31
1.2.2 Budget Expenditure in 2009:
Not applicable.
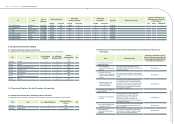
1.2.3 Financial Income and Earning Abilities
Unit: NT$ Thousand
Item 2009
Financial Income
Operating Revenue 573,982,544
Gross Prot 58,327,860
Income After Tax 11,353,374
Earning Abilities
Return on Assets (%) 4.42
Return on Equity (%) 12.92
Net Income ratio (%) 1.98
EPS (NT$) 4.31
1.3 2010 Business Plan
1.3.1 Business Direction
A. Implement the multi-brand strategy worldwide, with differentiated products to satisfy diverse customer needs
and market segments.
B. Attain a better balance of consumer and commercial PC businesses.
C. Capture opportunities in China and other emerging markets.
D. Accelerate the smartphone and mobile solution offering.
E. Continue to minimize operating expenses.
1.3.2 Goals
A. Expand worldwide mobile PC presence.
B. Expand global market share.
C. Increase operating margin.
D. Seize opportunities arising from new mobile communication devices and emerging markets.
1.3.3 Partner Strategy
A. Reinforce cooperation with rst-tier suppliers and channel partners.
B. Fully capitalize on partners’ resources.
C. Share the success by rewarding our partners.
1.3.4 Future Strategy
Make every endeavor to pursue the strategy for growth:
A. Enhance the channel business model to further improve efciency.
B. Generate more proportionate revenues from the geographies.
C. Enter the new ICT (Information and Communication Technology) market, grasp the business opportunity and
improve service offerings.
D. Increase efforts on corporate social responsibility.
1.3.5 Impact on Company Due to Competition, Governmental Regulations and Overall Macro Market
A. The global economy, notably the PC industry, is back on the recovery track after the nancial crisis; we expect
a good year in 2010.
B. The maturing PC market has yet to reach saturation, while new emerging markets will have stronger demand.
C. The decline of ASPs of PCs will decelerate as demand rises.
D. The emergence of a new ICT industry creates new opportunities in the form of products and services.
Acer Incorporated 2009 Annual Report
8.
Acer Incorporated 2009 Annual Report
9. Business Report