Acer 2009 Annual Report Download - page 52
Download and view the complete annual report
Please find page 52 of the 2009 Acer annual report below. You can navigate through the pages in the report by either clicking on the pages listed below, or by using the keyword search tool below to find specific information within the annual report.-
 1
1 -
2
-
3
-
4
-
5
-
6
-
7
-
8
-
9
-
10
-
11
-
12
-
13
-
14
-
15
-
16
-
17
-
18
-
19
-
20
-
21
-
22
-
23
-
24
-
25
-
26
-
27
-
28
-
29
-
30
-
31
-
32
-
33
-
34
-
35
-
36
-
37
-
38
-
39
-
40
-
41
-
 42
42 -
 43
43 -
 44
44 -
 45
45 -
 46
46 -
 47
47 -
 48
48 -
 49
49 -
 50
50 -
 51
51 -
 52
52 -
 53
53 -
 54
54 -
 55
55 -
 56
56 -
 57
57 -
 58
58 -
 59
59 -
 60
60 -
 61
61 -
 62
62 -
63
-
64
-
65
 |
 |

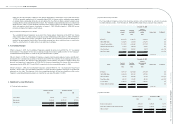
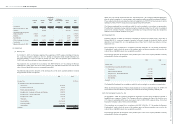
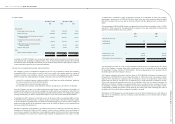
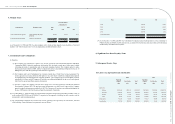
(c) The components of deferred income tax assets (liabilities) as of December 31, 2008 and 2009, were as
follows:
December 31, 2008 December 31, 2009
NT$ NT$ US$
Deferred income tax assets – current:
Unrealized cost of revenues 1,093,887 902,570 28,179
Inventory provisions 620,737 1,058,032 33,033
Loss (gain) on valuation of nancial instruments 156,932 (279,622) (8,730)
Accrued advertising expense 181,323 87,747 2,739
Accrued sales discounts 111,826 149,501 4,667
Warranty provision 894,085 778,287 24,299
Allowance for doubtful accounts 397,292 118,924 3,713
Accrued non-recurring engineering cost 86,315 58,825 1,837
Deferred revenue 34,904 5,614 175
Accrued royalty 82,975 494 16
Net operating loss carryforwards 77,977 143,674 4,485
Investment tax credits - 64,027 1,999
Unrealized foreign exchange (gains) losses (386,944) 299,738 9,358
Others 467,468 396,570 12,381
3,818,777 3,784,381 118,151
Valuation allowance (1,535,834) (1,571,166) (49,053)
2,282,943 2,213,215 69,098
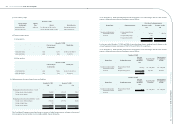
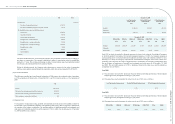
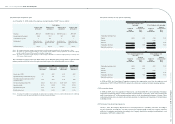
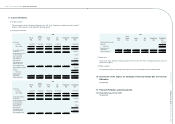
December 31, 2008 December 31, 2009
NT$ NT$ US$
Deferred income tax liabilities – current:
Inventory provisions (125,802) (84,598) (2,641)
Allowance for doubtful accounts (462,980) (559,274) (17,461)
Unrealized exchange gains (58,994) (15,078) (471)
Others (8,834) (21,764) (679)
(656,610) (680,714) (21,252)
December 31, 2008 December 31, 2009
NT$ NT$ US$
Deferred income tax assets – non-current:
Investment loss under the equity method 44,649 66,861 2,087
Difference in depreciation for tax and nancial purposes 20,638 16,462 514
Net operating loss carryforwards 773,919 410,104 12,804
Other 117,235 101,897 3,181
956,441 595,324 18,586
Valuation allowance (826,526) (387,735) (12,105)
129,915 207,589 6,481
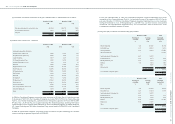
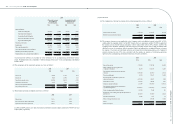
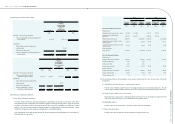
December 31, 2008 December 31, 2009
NT$ NT$ US$
Deferred income tax liabilities – non-current:
Difference in amortization of intangible assets for
tax and nancial purposes (2,705,258) (3,507,908) (109,519)
Investment income under the equity method (3,804,043) (2,867,839) (89,536)
Net operating loss carryforwards 14,326,766 13,313,903 415,670
Difference in depreciation for tax and nancial
purposes 1,026,013 811,822 25,346
Provision for asset impairment loss 313,148 245,347 7,660
Investment tax credits 418,227 - -
Software development cost 731,804 28,553 891
Unrealized investment loss 244,421 239,877 7,489
Foreign currency translation adjustment - (237,330) (7,410)
Other 463,409 316,950 9,895
11,014,487 8,343,375 260,486
Valuation allowance (17,288,586) (13,887,322) (433,572)
(6,274,099) (5,543,947) (173,086)
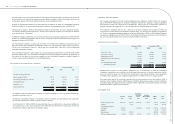
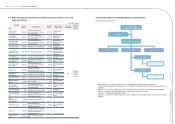
(d) The domestic Consolidated Companies were granted investment tax credits for the purchase of automatic
machinery and equipment, for research and development expenditures, and for personnel training
expenditures. These tax credits may be applied over a period of ve years. The amount of the credit that may
be applied in any year is limited to 50% of the income tax payable for that year, but there is no limitation on
the amount of investment tax credit that may be applied in the nal year.
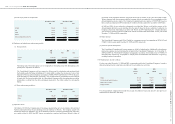
As of December 31, 2009, investment tax credits available to the Consolidated Companies were as follows:
Expiration date NT$ US$
December 31, 2012 1,646 52
December 31, 2013 49,412 1,542
December 31, 2014 12,969 405
64,027 1,999
(e) The tax effects of net operating loss carryforwards available to the Consolidated Companies as of December
31, 2009, were as follows:
Expiration date NT$ US$
December 31, 2010 845 26
December 31, 2011 805,840 25,159
December 31, 2012 1,042,362 32,543
December 31, 2013 579,938 18,106
Thereafter 11,438,696 357,125
13,867,681 432,959
Acer Incorporated 2009 Annual Report
98.
Acer Incorporated 2009 Annual Report
99. Financial Standing