Acer 2009 Annual Report Download - page 56
Download and view the complete annual report
Please find page 56 of the 2009 Acer annual report below. You can navigate through the pages in the report by either clicking on the pages listed below, or by using the keyword search tool below to find specific information within the annual report.-
 1
1 -
2
-
3
-
4
-
5
-
6
-
7
-
8
-
9
-
10
-
11
-
12
-
13
-
14
-
15
-
16
-
17
-
18
-
19
-
20
-
21
-
22
-
23
-
24
-
25
-
26
-
27
-
28
-
29
-
30
-
31
-
32
-
33
-
34
-
35
-
36
-
37
-
38
-
39
-
40
-
41
-
42
-
43
-
44
-
45
-
 46
46 -
 47
47 -
 48
48 -
 49
49 -
 50
50 -
 51
51 -
 52
52 -
 53
53 -
 54
54 -
 55
55 -
 56
56 -
 57
57 -
 58
58 -
 59
59 -
 60
60 -
 61
61 -
 62
62 -
 63
63 -
 64
64 -
 65
65
 |
 |

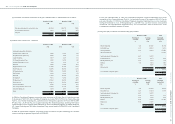
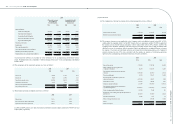
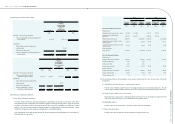
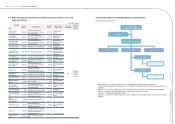
(23) Earnings per common share (“EPS”)
2008
Amount
Weighted-
average number
of outstanding
shares of
common stock
(in thousands)
EPS (in dollars)
NT$ NT$
Basic EPS – after retroactive adjustments
Net income attributable to common shareholders of
parent company 11,742,135 2,512,122 4.67
Diluted EPS
Effect of dilutive potential common shares:
Employee bonus - 39,042
Employee stock option plan - 1,286
Net income attributable to common shareholders of
parent company 11,742,135 2,552,450 4.60
2009
Amount (in thousand)
Weighted-
average number
of outstanding
shares of common
stock
(in thousands) EPS (in dollars)
NT$ US$ NT$ US$
Basic EPS – after retroactive adjustments
Net income attributable to common
shareholders of parent company 11,353,374 354,445
2,632,379 4.31 0.13
Diluted EPS
Effect of dilutive potential common shares:
Employee bonus - - 23,175
Employee stock option plan - - 10,953
Net income attributable to common
shareholders of parent company 11,353,374 354,445 2,666,507 4.26 0.13
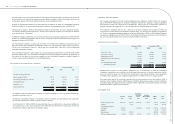
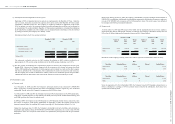
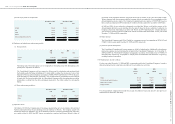
(24) Disclosure of nancial instruments
(a) Fair values of nancial instruments
The book value of short-term nancial instruments is considered to be the fair value because of the short-
term maturity of these instruments. Such method is applied to cash and cash equivalents, notes and accounts
receivable (including receivables from related parties), other receivables (including receivables from related
parties), notes and accounts payables (including payables to related parties), short-term borrowings, current
installments of long-term debt, payables to related parties and royalties payable.
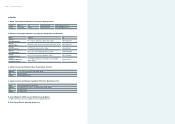
The estimated fair values and carrying amounts of all other nancial assets and liabilities as of December 31,
2008 and 2009 were as follows:
2008 2009
Fair value Fair value
Carrying
amount
Public quoted
price
Valuation
amount
Carrying
amount
Public quoted
price
Valuation
amount
NT$ NT$ NT$ NT$ NT$ NT$
Non-derivative nancial instruments
Financial assets:
Available-for-sale nancial assets – current 591,444 591,444 - 223,437 223,437 -
Available-for-sale nancial assets –
noncurrent 1,160,487 1,160,487 - 3,306,742 3,306,742 -
Financial assets carried at cost 2,684,270 - see below(b) 2,251,058 - see below(b)
Refundable deposits (classied as “other
nancial assets”) 781,080 - 781,080 771,957 - 771,957
Noncurrent receivables (classied as “other
nancial assets”) 87,680 - 87,680 17,754 - 17,754
Financial liabilities:
Long-term debt 4,134,920 - 4,134,920 12,371,856 - 12,371,856
Derivative nancial instruments
Financial assets:
Foreign currency forward contracts 1,302,085 - 1,302,085 1,414,672 - 1,414,672
Foreign exchange swap 7,113 - 7,113 - - -
Cross currency swap 7,821 - 7,821 - - -
Foreign currency options 60,514 - 60,514 18,144 - 18,144
Financial liabilities:
Foreign currency forward contracts 1,860,465 - 1,860,465 354,562 - 354,562
Foreign currency options 23,298 - 23,298 4,691 - 4,691
Foreign exchange swap 14 - 14 - - -
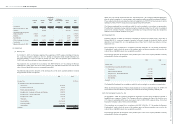
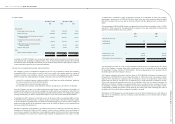
(b) The following methods and assumptions were used to estimate the fair value of each class of financial
instruments:
(i) Available-for-sale nancial assets – current and non-current
The fair value of publicly traded stocks is the closing quotation price at the balance sheet date. The fair
value of open-end mutual funds is based on the net asset value of the mutual funds at balance sheet date.
(ii) Financial assets carried at cost – non-current
Financial assets carried at cost represent privately held stock. It is not practicable to estimate the fair
value of privately held stock as it is not traded in an active public market.
(iii) Refundable deposits
The fair values are the book values as the date of expiry cannot be determined.
(iv) Non-current receivables
The fair values are their present value discounted at the market interest rate.
Acer Incorporated 2009 Annual Report
106.
Acer Incorporated 2009 Annual Report
107. Financial Standing