Acer 2009 Annual Report Download - page 60
Download and view the complete annual report
Please find page 60 of the 2009 Acer annual report below. You can navigate through the pages in the report by either clicking on the pages listed below, or by using the keyword search tool below to find specific information within the annual report.-
 1
1 -
2
-
3
-
4
-
5
-
6
-
7
-
8
-
9
-
10
-
11
-
12
-
13
-
14
-
15
-
16
-
17
-
18
-
19
-
20
-
21
-
22
-
23
-
24
-
25
-
26
-
27
-
28
-
29
-
30
-
31
-
32
-
33
-
34
-
35
-
36
-
37
-
38
-
39
-
40
-
41
-
42
-
43
-
44
-
45
-
46
-
47
-
48
-
49
-
 50
50 -
 51
51 -
 52
52 -
 53
53 -
 54
54 -
 55
55 -
 56
56 -
 57
57 -
 58
58 -
 59
59 -
 60
60 -
 61
61 -
 62
62 -
 63
63 -
 64
64 -
 65
65
 |
 |

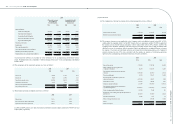
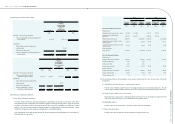
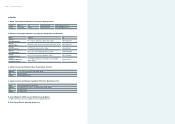
11. Segment Information
(1) Industry segment
The main business of the Consolidated Companies is to sell “Acer” brand-name computers and other related IT
products, which represents a single reportable operating segment.
(2) Geographic information
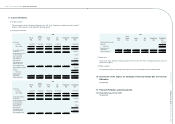
2008
Taiwan
North
America Europe Asia Eliminations Consolidated
NT$ NT$ NT$ NT$ NT$ NT$
Area income:
Customers 25,879,015 152,469,649 279,790,219 90,925,741 - 549,064,624
Inter-company 341,107,152 3,203 6,057,224 13,642 (347,181,221) -
366,986,167 152,472,852 285,847,443 90,939,383 (347,181,221) 549,064,624
Area prot (loss) before
income taxes 342,361,748 (1,044,322) 15,501,048 3,361,512 (347,181,221)
12,998,765
Net investment income by
the equity method 404,184
Gain on disposal of
investments, net 2,709,524
Interest expense (1,305,746)
Consolidated income
before income taxes 14,806,727
Area identiable assets 111,929,202 47,044,049 95,789,881 25,518,735 (62,342,472) 217,939,395
Equity method investments 2,928,790
Goodwill 22,574,040
Total assets 243,442,225
Depreciation and
amortization 685,120 1,090,051 290,210 136,060 - 2,201,441
Capital expenditures 171,677 220,011 154,207 205,397 - 751,292
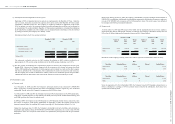
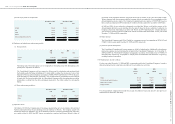
2009
Taiwan
North
America Europe Asia Eliminations Consolidated
NT$ NT$ NT$ NT$ NT$ NT$
Area income:
Customers 32,527,383 153,258,163 294,783,234 107,213,050 - 587,781,830
Inter-company 404,809,061 187,495 6,404,956 7,297 (411,408,809) -
437,336,444 153,445,658 301,188,190 107,220,347 (411,408,809) 587,781,830
Area prot (loss) before
income taxes 354,733,460 (3,051,275) 71,362,909 3,489,518 (411,408,809) 15,125,803
Net investment income by
the equity method 400,098
Gain on disposal of
investments, net
79,162
Interest expense (622,080)
Consolidated income
before income taxes 14,982,983
Area identiable assets 154,584,475 68,774,280 106,947,852 32,809,119 (97,383,442) 265,732,284
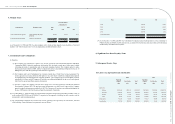
2009
Taiwan
North
America Europe Asia Eliminations Consolidated
NT$ NT$ NT$ NT$ NT$ NT$
Equity method investments 3,314,950
Goodwill 21,977,454
Total assets 291,024,688
Depreciation and
amortization 1,064,578 667,269 847,796 126,944 - 2,706,587
Capital expenditures 413,968 30,381 243,081 84,145 - 771,575
(3) Export sales
Export sales of the domestic operating segments do not exceed 10% of the consolidated revenues, hence no
disclosure is required.
(4) Major customers:
No individual customers accounting for more than 10% of the consolidated revenues in 2008 and 2009.
7.5 Disclosure of the Impact on Company’s Financial Status Due to Financial
Difculties
Not applicable.
7.6 Financial Prediction and Achievements
7.6.1 Financial Forecast of Year 2010:
Not applicable.
Acer Incorporated 2009 Annual Report
114.
Acer Incorporated 2009 Annual Report
115. Financial Standing