Acer 2009 Annual Report Download - page 18
Download and view the complete annual report
Please find page 18 of the 2009 Acer annual report below. You can navigate through the pages in the report by either clicking on the pages listed below, or by using the keyword search tool below to find specific information within the annual report.-
 1
1 -
2
-
3
-
4
-
5
-
6
-
7
-
 8
8 -
 9
9 -
 10
10 -
 11
11 -
 12
12 -
 13
13 -
 14
14 -
 15
15 -
 16
16 -
 17
17 -
 18
18 -
 19
19 -
 20
20 -
 21
21 -
 22
22 -
 23
23 -
 24
24 -
 25
25 -
 26
26 -
 27
27 -
 28
28 -
29
-
30
-
31
-
32
-
33
-
34
-
35
-
36
-
37
-
38
-
39
-
40
-
41
-
42
-
43
-
44
-
45
-
46
-
47
-
48
-
49
-
50
-
51
-
52
-
53
-
54
-
55
-
56
-
57
-
58
-
59
-
60
-
61
-
62
-
63
-
64
-
65
 |
 |
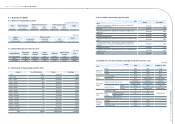
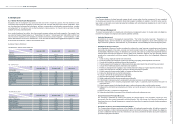
4.1 Sources of Capital
4.1.1 Sources of Capital (April 20, 2010)
Unit: Share/NT$ Thousand
Date Price of Issuance Authorized Common stock Paid-in Common stock Notes
Shares Value Shares Value
April, 2010 Share/NT$10 3,500,000,000 35,000,000 2,689,301,462 26,893,015 -
Unit: Share
Shares
Category
Authorized capital Notes
Issued shares Non-issued Total
Common shares 2,689,301,462 810,698,538 3,500,000,000 -
4.1.2 Shareholding Structure (April 20, 2010)
Unit: Share
Category/Number Government
Institution
Financial
Institution
Other
Institution Individual FINI and Foreign
Investors Total
No. of Shareholders 22 21 492 264,709 1,376 266,620
Shares 50,582,999 39,031,519 178,020,969 745,312,791 1,676,353,184 2,689,301,462
Percentage 1.88% 1.45% 6.62% 27.71% 62.33% 100.00%
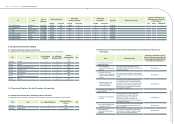
4.1.3 Distribution of Shareholdings (April 20, 2010)
Category No. of Shareholders Shares Percentage
1 ~ 999 159,715 48,530,716 1.805%
1,000 ~ 5,000 82,981 174,664,708 6.495%
5,001 ~ 10,000 13,144 92,428,000 3.437%
10,001 ~ 15,000 4,207 50,490,336 1.877%
15,001 ~ 20,000 1,876 32,714,845 1.216%
20,001 ~ 30,000 1,668 40,466,743 1.505%
30,001 ~ 50,000 1,115 42,585,973 1.584%
50,001 ~ 100,000 716 49,930,108 1.857%
100,001 ~ 200,000 378 53,156,988 1.977%
200,001 ~ 400,000 280 80,311,793 2.986%
400,001 ~ 600,000 131 64,418,679 2.395%
600,001 ~ 800,000 92 65,472,265 2.435%
800,001 ~ 1,000,000 46 41,044,919 1.526%
1,000,001 and above 271 1,853,085,389 68.906%
Total 266,620 2,689,301,462 100.000%
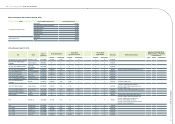
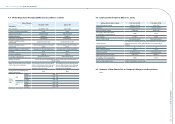
4.1.4 List of Major Shareholders (April 20, 2010)
Item
Name Shares Percentage
JPMorgan Chase Bank N.A. Taipei Branch in custody for Capital World
Growth and Income Fund Inc. 127,236,451 4.73%
Acer GDR 82,947,962 3.08%
JPMorgan Chase Bank N.A. Taipei Branch in custody for Capital Income
Builder, Inc. 76,420,444 2.84%
Stan Shih 74,761,958 2.78%
Hong Rong Investment Corp. 67,731,471 2.52%
JPMorgan Chase Bank N.A. Taipei Branch in custody for EuroPacic Growth
Fund 60,547,830 2.25%
JPMorgan Chase Bank N.A., Taipei Branch in custody for Saudi Arabian
Monetary Agency - Credit Agricole Asset Management as external fund
manager
54,450,241 2.02%
JPMorgan Securities Ltd. 43,368,893 1.61%
JPMorgan Chase Bank N.A. Taipei Branch in custody for Emerging Markets
Growth Fund, Inc. 33,953,950 1.26%
Fidelity Funds 33,056,400 1.23%
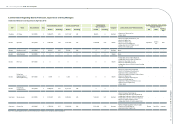
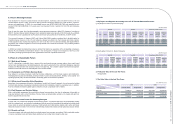
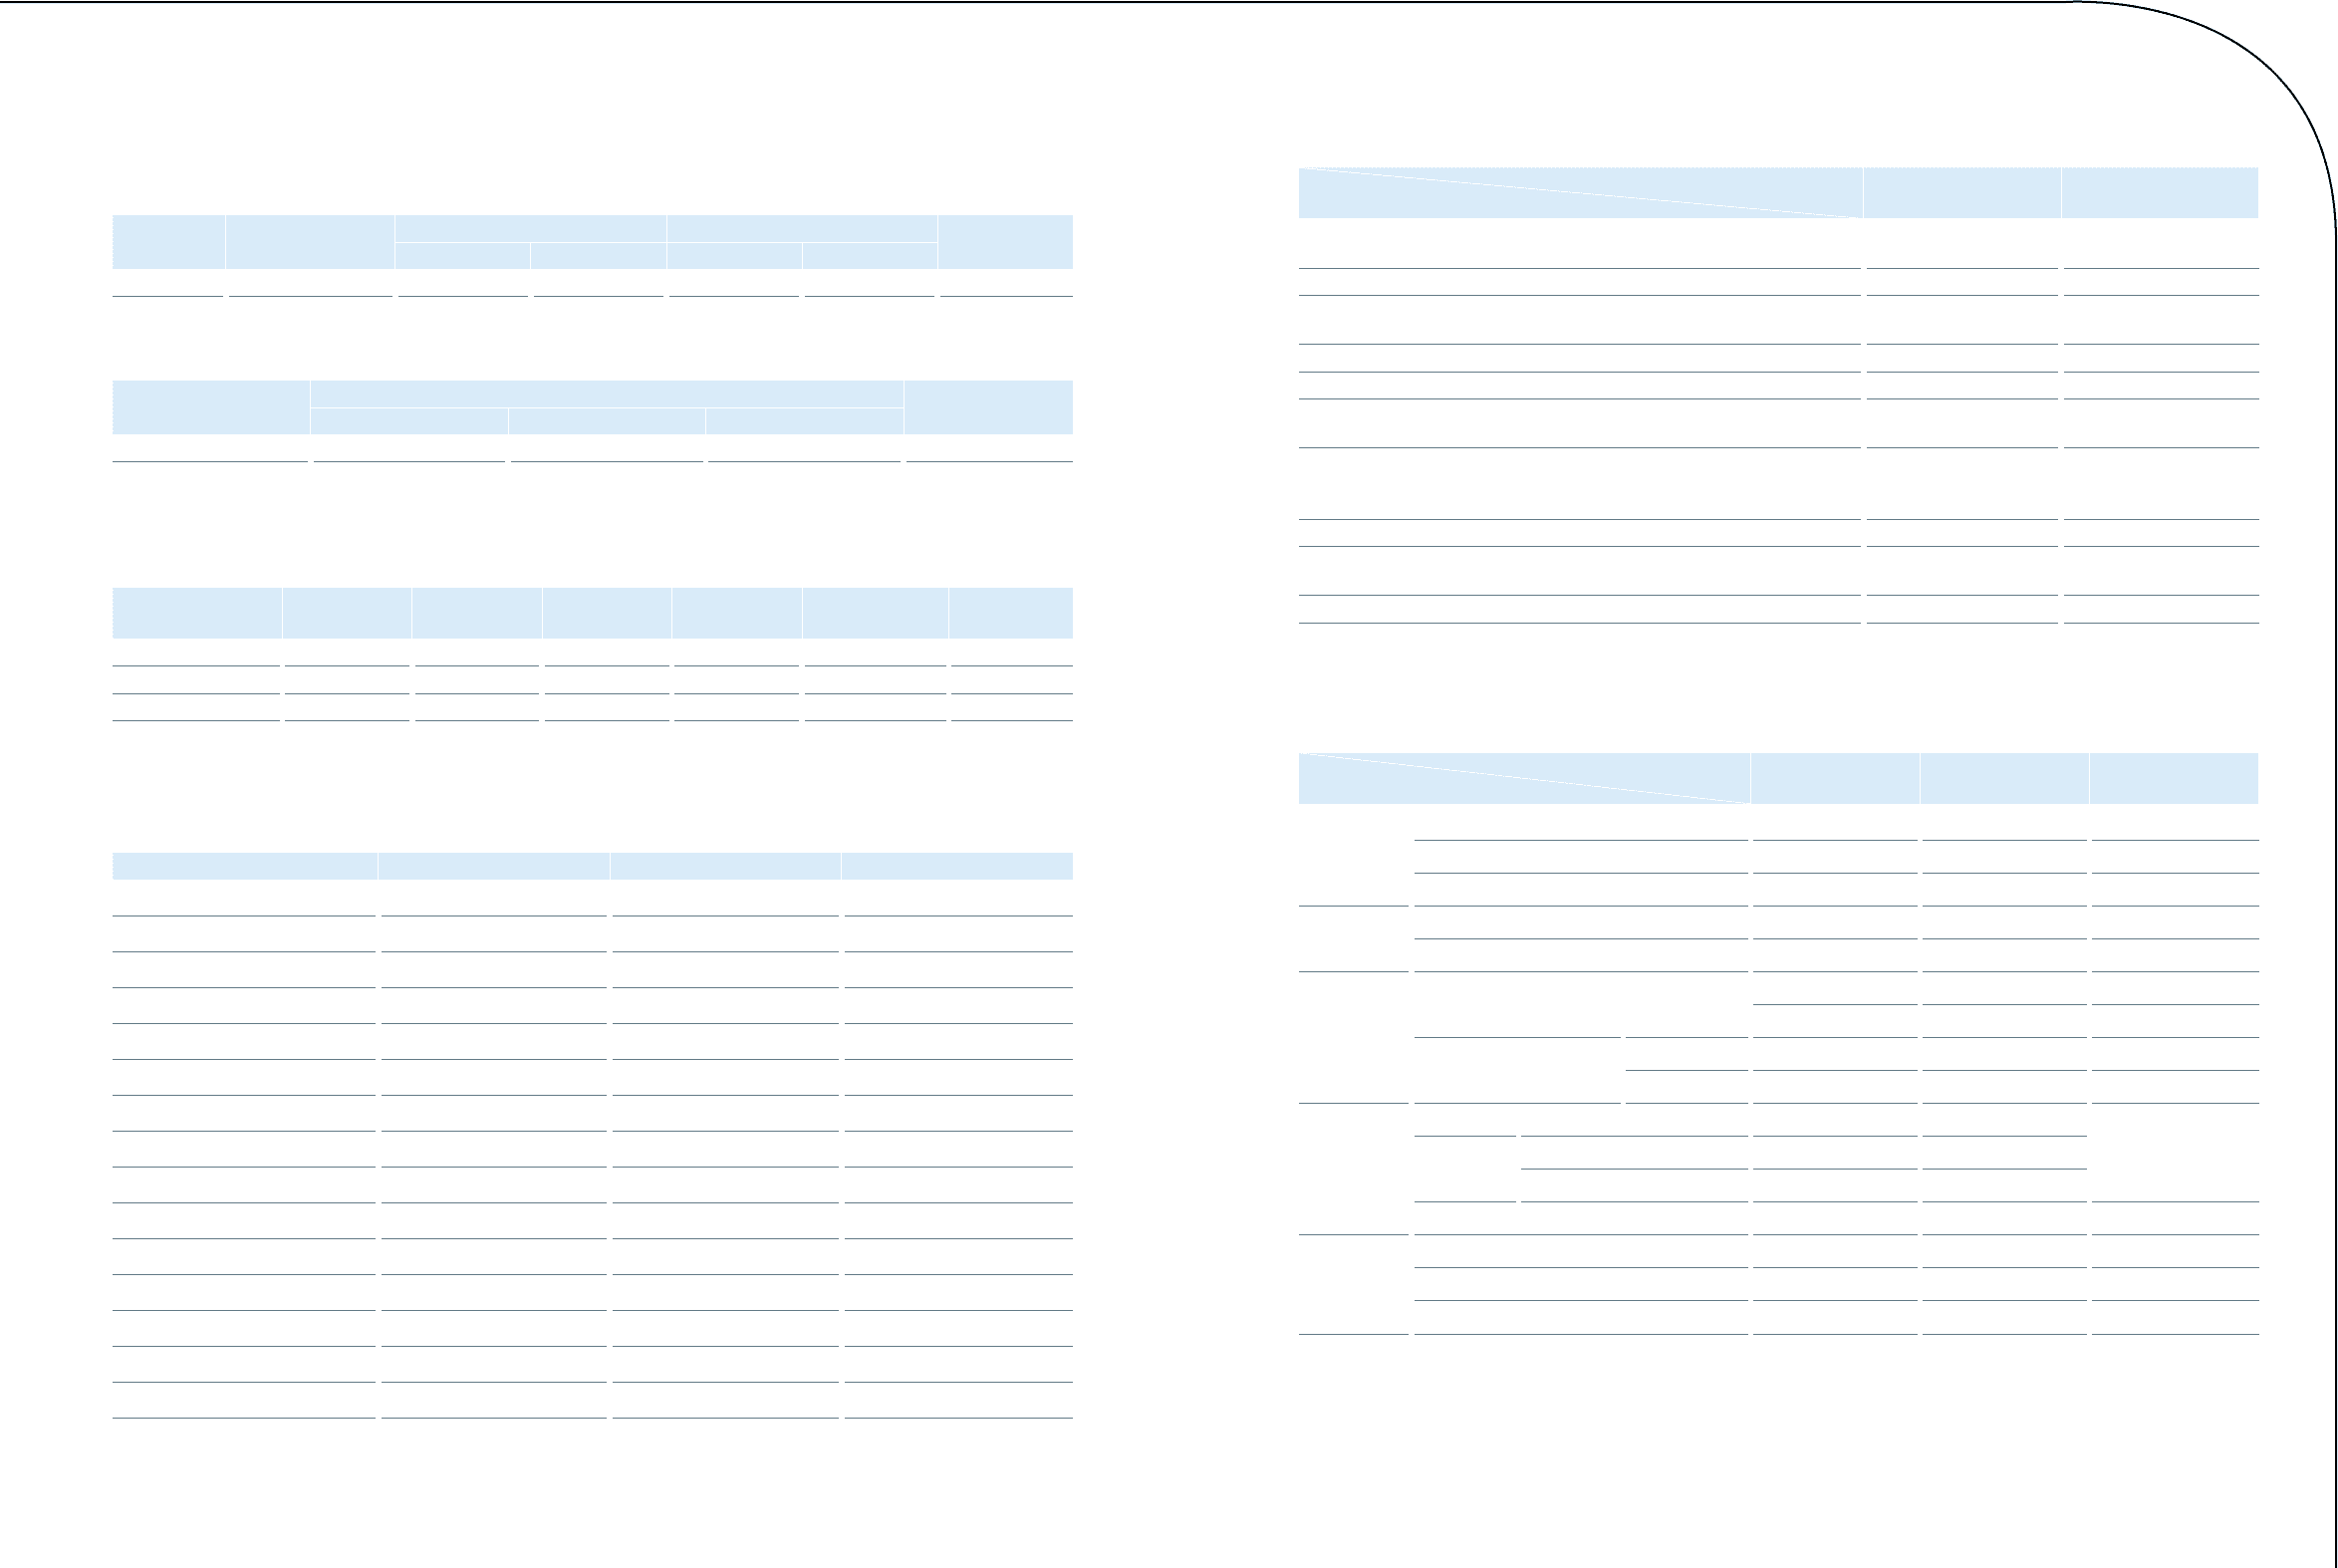
4.1.5 Market Price Per Share, Net Value, Earning& Dividend For Last Two Years
Unit: NT$
Period
Item 2008 2009 Until Mar. 31, 2010
Market Price
Per Share
Highest 69.46 96.20 103.00
Lowest 39.33 39.65 84.50
Average 54.92 65.58 94.47
Net Value Per
Share
Before Distribution 31.70 31.16 35.74
After Distribution 29.16 Un-appropriated Un-appropriated
Earnings Per
Share
Weighted Average Share Numbers
2,513,243 2,632,379 2,642,374
Thousand shares Thousand shares Thousand shares
Earning Per Share
Current 4.72 4.31 1.25
Adjusted 4.67 Un-appropriated Un-appropriated
Dividend Per
Share
Cash Dividend (NT$) 2 3.1
Un-appropriated
Stock
Dividend
Retained Earning (%) 0.1 0.01
Capital Surplus (%) - -
Accumulated Unpaid Dividends - - -
Return on
Investment
Analysis
P/E Ratio 11.64 15.22 -
P/D Ratio 27.46 21.15 -
Cash Dividend Yield 3.64% 4.73% -
Acer Incorporated 2009 Annual Report
30.
Acer Incorporated 2009 Annual Report
31. Capital and Shares