Acer 2009 Annual Report Download - page 29
Download and view the complete annual report
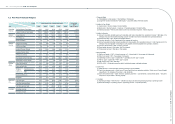
Please find page 29 of the 2009 Acer annual report below. You can navigate through the pages in the report by either clicking on the pages listed below, or by using the keyword search tool below to find specific information within the annual report.-
 1
1 -
2
-
3
-
4
-
5
-
6
-
7
-
8
-
9
-
10
-
11
-
12
-
13
-
14
-
15
-
16
-
17
-
18
-
 19
19 -
 20
20 -
 21
21 -
 22
22 -
 23
23 -
 24
24 -
 25
25 -
 26
26 -
 27
27 -
 28
28 -
 29
29 -
 30
30 -
 31
31 -
 32
32 -
 33
33 -
 34
34 -
 35
35 -
 36
36 -
 37
37 -
 38
38 -
 39
39 -
40
-
41
-
42
-
43
-
44
-
45
-
46
-
47
-
48
-
49
-
50
-
51
-
52
-
53
-
54
-
55
-
56
-
57
-
58
-
59
-
60
-
61
-
62
-
63
-
64
-
65
 |
 |

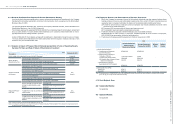
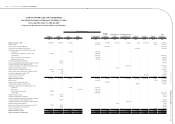
7.1 Five-Year Consolidated Financial Information
7.1.1 Five-Year Balance Sheet
As of March 31, 2010
Unit: NT$ Thousand
Period
Item
Most Recent 5-Year Financial Information Current year
as of
Mar. 31, 2010
2005 2006 2007 2008 2009
Current Assets 139,242,560 161,267,661 191,626,201 186,390,592 232,107,877 222,417,223
Fund and Long-term Equity
Investments 17,605,973 13,835,538 11,202,652 6,773,547 8,872,750 8,698,686
Net Property, Plant and Equipment 9,468,157 6,190,501 8,636,441 9,336,221 8,676,173 8,567,366
Intangible Assets 501,878 396,682 25,926,493 34,746,765 35,444,068 34,823,623
Other Assets 4,763,374 6,809,916 5,891,555 6,195,100 5,923,820 6,261,308
Total Assets 171,581,942 188,500,298 243,283,342 243,442,225 291,024,688 280,768,208
Current
Liabilities
Before Distribution 102,158,601 109,970,460 142,842,574 149,315,158 179,846,517 167,693,185
After Distribution 109,390,340 119,487,678 154,601,124 154,601,124 Un-appropriated Un-appropriated
Long-term Liabilities 146,623 168,627 16,790,876 4,134,920 12,371,856 12,361,548
Other Liabilities 2,027,268 2,805,428 6,240,899 7,114,532 5,928,652 5,846,443
Total Liabilities Before Distribution 104,332,491 112,944,515 165,874,348 160,564,610 198,147,026 185,901,176
After Distribution 111,564,230 122,461,733 165,850,575 165,850,575 Un-appropriated Un-appropriated
Common Stock 22,545,187 23,370,637 24,054,904 26,428,560 26,882,283 26,882,283
Capital Surplus 30,552,132 29,947,020 29,898,982 37,129,952 38,494,118 38,616,522
Retained
Earnings
Before Distribution 16,123,212 18,284,265 21,041,713 22,771,901 28,575,011 31,869,488
After Distribution 8,891,473 8,767,047 17,485,935 17,485,935 Un-appropriated Un-appropriated
Unrealized Gain (loss) on Financial
Assets 65,608 4,361,608 2,524,500 (1,729,631) 1,014,317 860,955
Translation Adjustments (226,806) 1,335,500 2,733,899 1,241,058 959,621 (305,102)
Minimum Pension Liability Adjustment (0) 0 (173,364) (283) (7,908) (4,367)
Treasury Stock (3,270,920) (3,270,920) (3,270,920) (3,522,598) (3,522,598) (3,522,598)
Minority Interest 1,461,038 1,527,674 599,280 558,656 482,819 469,851
Stockholders’
Equity
Before Distribution 67,249,451 75,555,783 77,408,994 82,877,615 92,877,662 94,867,032
After Distribution 60,017,712 66,038,565 77,591,648 77,591,648 Un-appropriated Un-appropriated
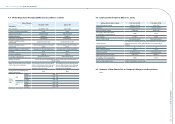
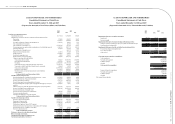
7.1.2 Five-Year Consolidated Income Statement
Unit: NT$ Thousand
Period
Item
Most Recent 5-Year Financial Information Current year
as of
Mar. 31, 2010
2005 2006 2007 2008 2009
Operating Revenue 318,087,679 350,816,353 462,066,080 546,274,115 573,982,544 162,129,895
Gross Prot 34,121,461 38,171,313 47,418,310 57,285,660 58,327,860 15,713,786
Operating (Loss) Income 7,648,961 7,462,446 10,185,123 14,072,302 15,339,466 4,385,394
Non-operating Income and Gain 7,176,374 9,266,120 6,699,671 5,353,038 1,719,037 360,534
Non-operating Expense and Loss 4,172,803 3,180,259 1,776,157 4,618,613 2,075,520 587,185
Continuing Operating Income
Before Tax 10,652,532 13,548,307 15,108,637 14,806,727 14,982,983 4,158,743
Income(Loss) from Discontinuned
Segment 0 0 517,866 99,843 0 0
Extraordinary Items 0 0 0 0 0 0
Cumulative Effect of Changes in
Accounting Principle 0 0 0 0 0 0
Income After Income Taxes 8,477,502 10,218,242 12,958,933 11,742,135 11,353,374 3,294,477
EPS 3.45 4.16 5.27 4.67 4.31 1.25
7.1.3 CPAs and Auditors’ Opinions
Year Name of CPA(s) Auditors’ Opinion
2005 Sonia Chang, Winston Yu Modied unreserved
2006 Winston Yu, Albert Lou Modied unreserved
2007 Sonia Chang, Winston Yu Unreserved
2008 Sonia Chang, Agnes Yang Modied unreserved
2009 Sonia Chang, Agnes Yang Unreserved
Acer Incorporated 2009 Annual Report
52.
Acer Incorporated 2009 Annual Report
53. Financial Standing