Acer 2009 Annual Report Download - page 33
Download and view the complete annual report
Please find page 33 of the 2009 Acer annual report below. You can navigate through the pages in the report by either clicking on the pages listed below, or by using the keyword search tool below to find specific information within the annual report.-
 1
1 -
2
-
3
-
4
-
5
-
6
-
7
-
8
-
9
-
10
-
11
-
12
-
13
-
14
-
15
-
16
-
17
-
18
-
19
-
20
-
21
-
22
-
 23
23 -
 24
24 -
 25
25 -
 26
26 -
 27
27 -
 28
28 -
 29
29 -
 30
30 -
 31
31 -
 32
32 -
 33
33 -
 34
34 -
 35
35 -
 36
36 -
 37
37 -
 38
38 -
 39
39 -
 40
40 -
 41
41 -
 42
42 -
 43
43 -
44
-
45
-
46
-
47
-
48
-
49
-
50
-
51
-
52
-
53
-
54
-
55
-
56
-
57
-
58
-
59
-
60
-
61
-
62
-
63
-
64
-
65
 |
 |
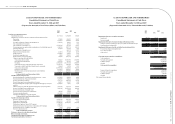
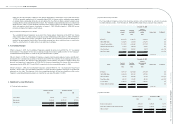
ACER INCORPORATED AND SUBSIDIARIES
Consolidated Balance Sheets
December 31, 2008 and 2009
(Expressed in thousands of New Taiwan dollars and US dollars)
Liabilities and Stockholders’ Equity 2008 2009
NT$ NT$ US$
Current liabilities:
Short-term borrowings (notes 4(15) and 6) 1,086, 851 548,059 17,111
Current portion of long-term debt (notes 4(16) and 6) 8,250,000 - -
Notes and accounts payable 64,365,616 95,831,720 2,991,936
Notes and accounts payables to related parties (note 5) 7,750,220 10,232,364 319,462
Financial liabilities at fair value through prot or loss ‒ current (notes 4(5) and 4(24)) 1,011,739 162,539 5,075
Other payables to related parties (note 5) 189,964 92,187 2,878
Hedging purpose derivative nancial liabilities ‒ current (notes 4(6) and 4(24)) 872,038 196,714 6,142
Royalties payable 13,228,769 16,337,817 510,079
Accrued expenses and other current liabilities 51,903,351 55,764,403 1,741,005
Deferred income tax liabilities ‒ current (note 4(18)) 656,610 680,714 21,252
Total current liabilities 149,315,158 179,846,517 5,614,940
Long-term liabilities:
Long-term debt, excluding current portion (notes 4(16), 4(24) and 6) 4,134,920 12,371,856 386,258
Other liabilities (note 4(17)) 840,433 384,706 12,011
Deferred income tax liabilities ‒ noncurrent (note 4(18)) 6,274,099 5,543,947 173,086
Total long-term liabilities 11,249,452 18,300,509 571,355
Total liabilities 160,564,610 198,147,026 6,186,295
Stockholders’ equity and minority interest:
Common stock (notes 4(19) and 4(20)) 26,428,560 26,882,283 839,285
Capital surplus (notes 4(9) and 4(19)) 37,129,952 38,494,118 1,201,814
Retained earnings
Legal reserve 8,786,583 9,960,796 310,983
Special reserve - 1,991,615 62,180
Unappropriated earnings (note 3) 13,985,318 16,622,600 518,970
Other equity components
Foreign currency translation adjustment 1,241,058 959,621 29,960
Minimum pension liability adjustment (283) (7,908) (247)
Unrealized gain (loss) on available-for-sale nancial assets (note 4(10)) (1,456,066) 1,001,919 31,280
Hedging reserve (Note 4(6)) (273,565) 12,398 387
Treasury stock (note 4(19)) (3,522,598) (3,522,598) (109,978)
Total stockholders’ equity 82,318,959 92,394,844 2,884,634
Minority interest 558,656 482,818 15,074
Total stockholders’ equity and minority interest 82,877,615 92,877,662 2,899,708
Commitments and contingencies (note 7)
Total liabilities and stockholders’ equity 243,442,225 291,024,688 9,086,003
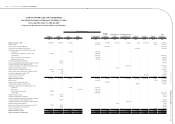
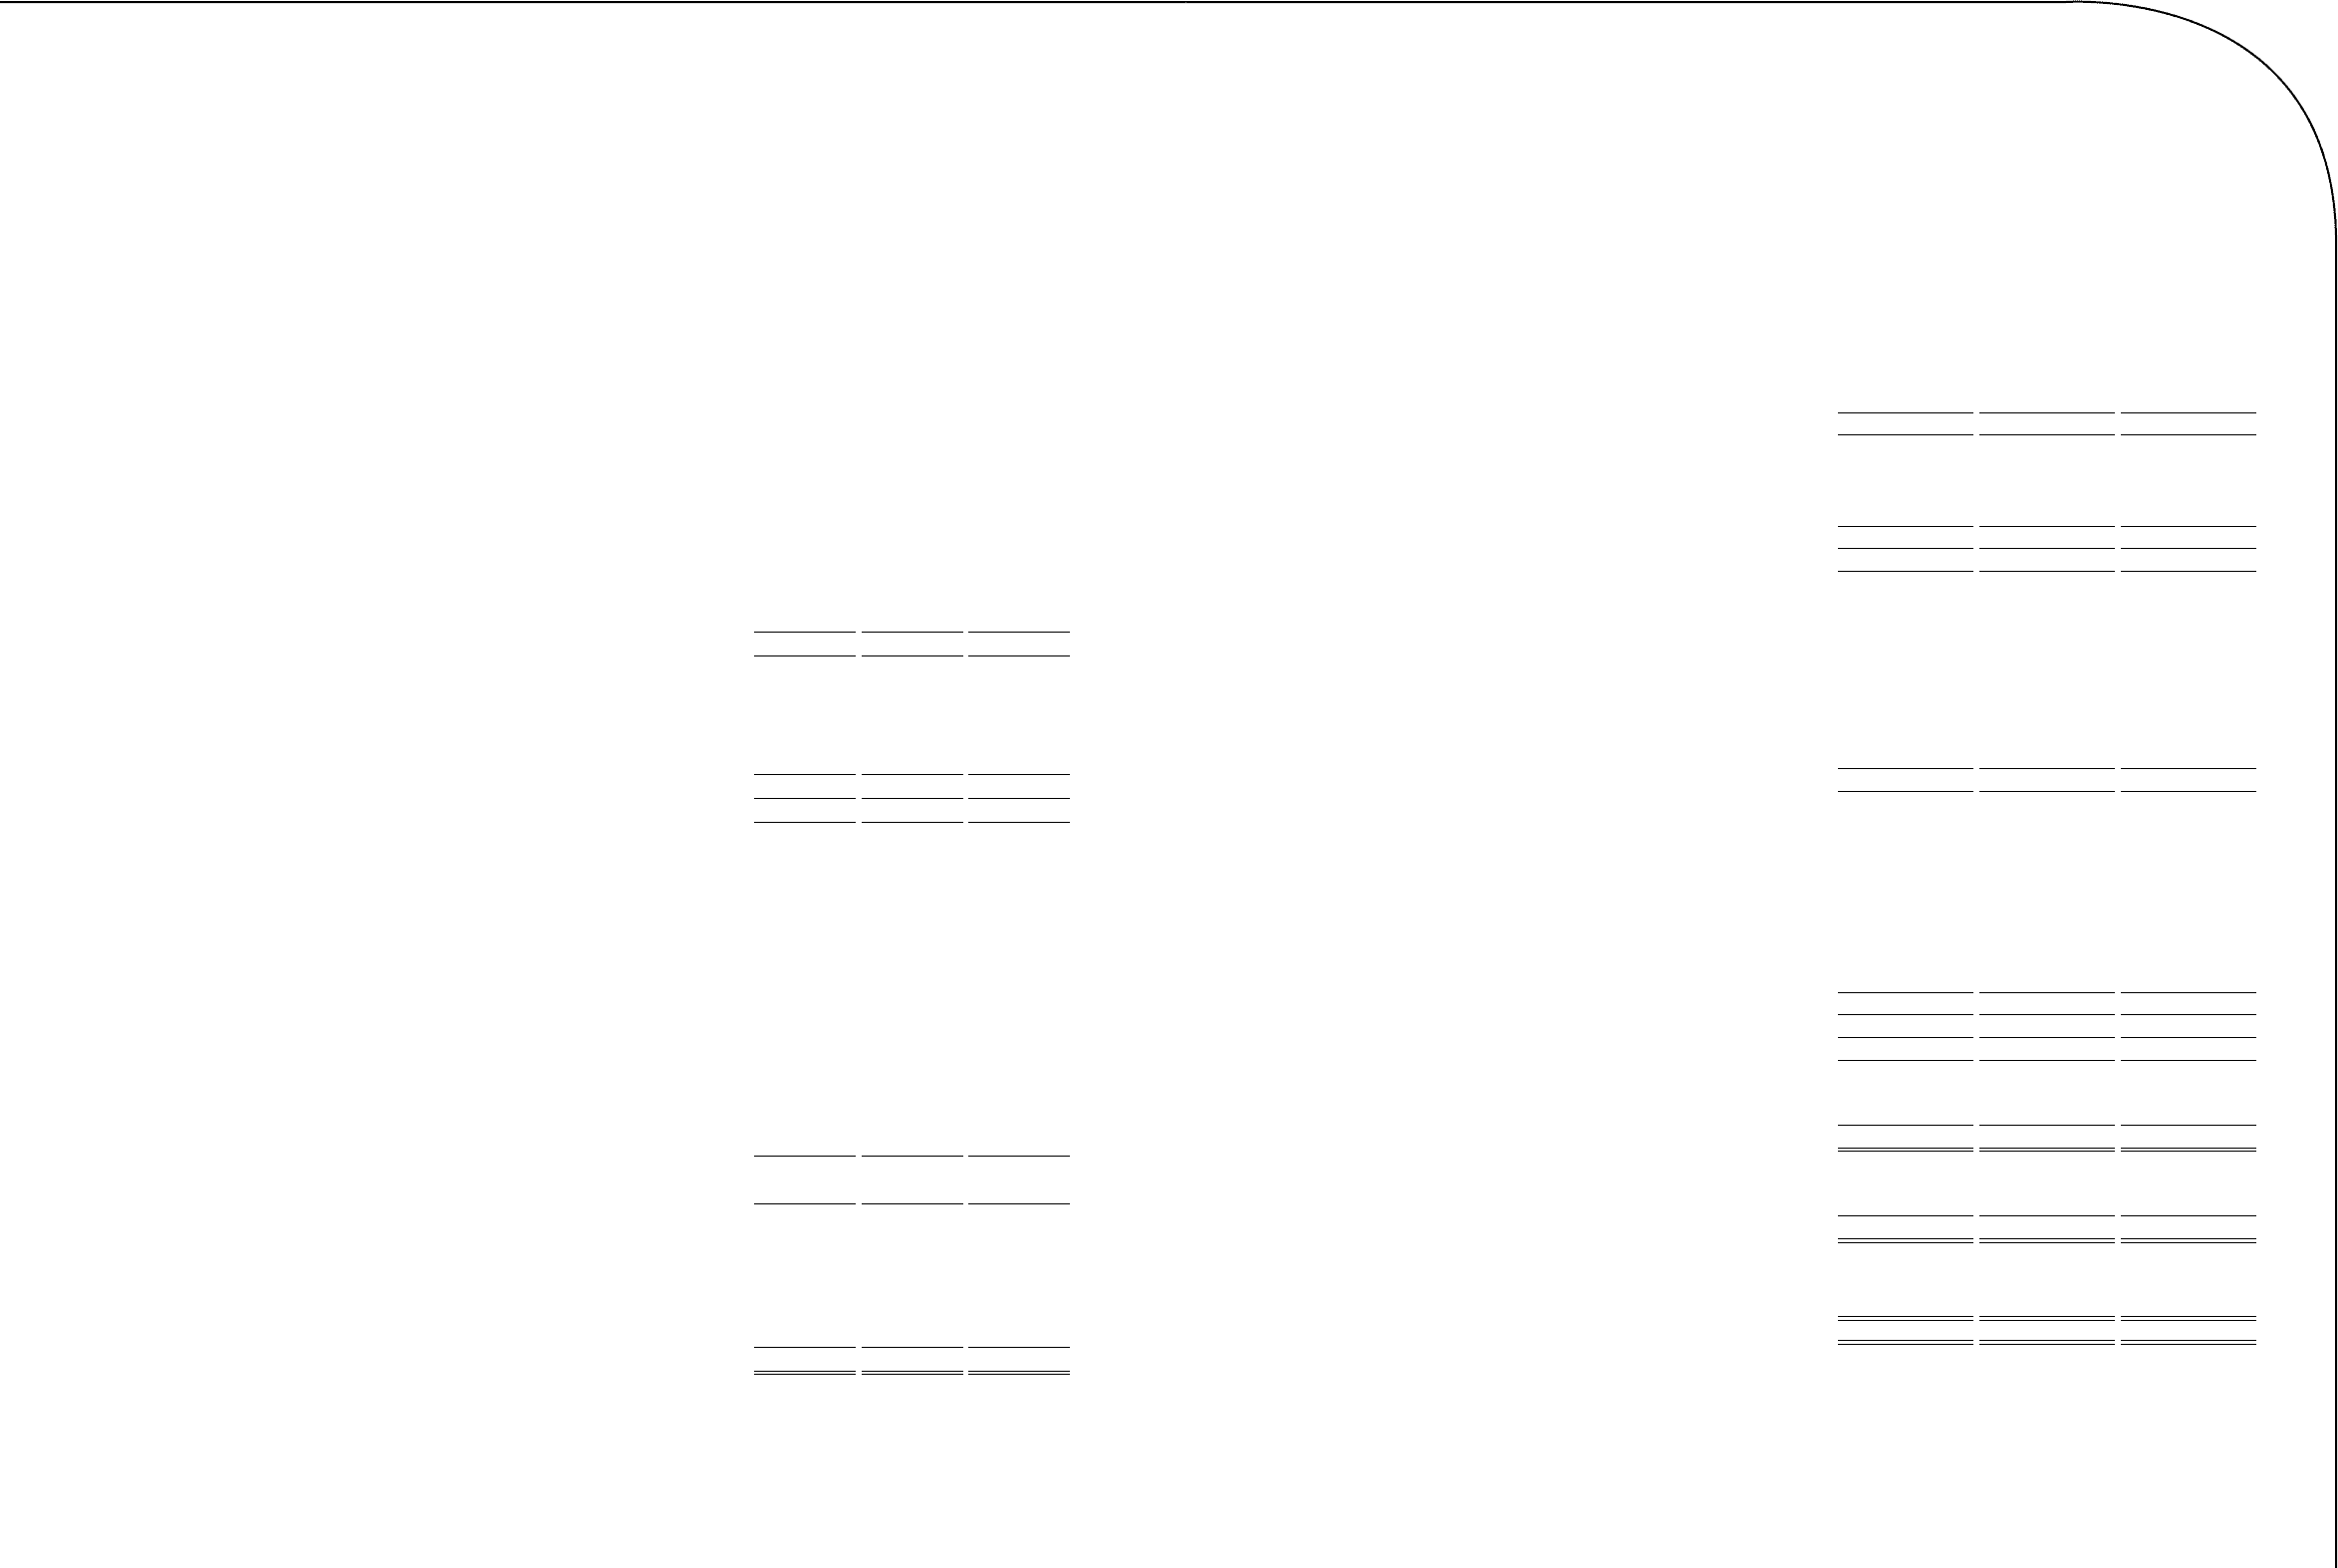
ACER INCORPORATED AND SUBSIDIARIES
Consolidated Statements of Income
Years ended December 31, 2008 and 2009
(Expressed in thousands of New Taiwan dollars and US dollars, except for per share data)
2008 2009
NT$ NT$ US$
Revenues (note 5) 546,274,115 573,982,544 17,920,154
Cost of revenues (notes 4(7) and 5) (488,988,455) (515,654,684) (16,099,116)
Gross prot 57,285,660 58,327,860 1,821,038
Operating expenses (notes 4(13), 4(17), 4(20), 5 and 10)
Selling (35,764,261) (35,729,296) (1,115,495)
Administrative (6,899,059) (6,372,585) (198,957)
Research and development (550,038) (886,513) (27,677)
Total operating expenses (43,213,358) (42,988,394) (1,342,129)
Operating income 14,072,302 15,339,466 478,909
Non-operating income and gains:
Interest income 1,207,826 361,656 11,291
Investment gain recognized using equity method, net (note 4(9))
404,184
400,098 12,491
Gain on disposal of property and equipment, net (note 4(11)) 515,272 - -
Gain on disposal of investments, net (notes 4(4), 4(8), 4(9) and 4(10)) 2,709,524 79,162 2,472
Foreign currency exchange gain and valuation gain on nancial
instruments, net (notes 4(5) and 4(6)) - 473,648 14,788
Other income (note 4(9)) 516,232 404,473 12,628
5,353,038 1,719,037 53,670
Non-operating expenses and losses:
Interest expense (1,305,746) (622,080) (19,422)
Other investment loss (note 4(8)) (416,404) (231,934) (7,241)
Loss on disposal of property and equipment, net (note 4(11)) - (103,055) (3,217)
Restructuring cost (note 4(21)) (1,582,408) (164,595) (5,139)
Foreign currency exchange loss and valuation loss on nancial
instruments, net (notes 4(5) and 4(6)) (866,315) - -
Impairment of non-nancial assets (notes 4(11) and 4(12)) (221,931) (395,109) (12,336)
Other loss (225,809) (558,747) (17,444)
(4,618,613) (2,075,520) (64,799)
Income from continuing operations before income taxes 14,806,727 14,982,983 467,780
Income tax expense (note 4(18)) (3,169,446) (3,630,123) (113,335)
Income from continuing operations 11,637,281 11,352,860 354,445
Income from discontinued operations (net of income taxes of NT$0)
(note 4(22)) 99,843 - -
Consolidated net income 11,737,124 11,352,860 354,445
Net income attributable to:
Shareholders of parent company 11,742,135 11,353,374 354,445
Minority shareholders (5,011) (514) (16)
11,737,124 11,352,860 354,445
Earnings per common share (in New Taiwan dollars) (note 4(23)): NT$ NT$ US$
Basic earnings per common share-retroactively adjusted 4.67 4.31 0.13
Diluted earnings per common share 4.60 4.26 0.13
Acer Incorporated 2009 Annual Report
60.
Acer Incorporated 2009 Annual Report
61. Financial Standing