Acer 2009 Annual Report Download - page 46
Download and view the complete annual report
Please find page 46 of the 2009 Acer annual report below. You can navigate through the pages in the report by either clicking on the pages listed below, or by using the keyword search tool below to find specific information within the annual report.-
 1
1 -
2
-
3
-
4
-
5
-
6
-
7
-
8
-
9
-
10
-
11
-
12
-
13
-
14
-
15
-
16
-
17
-
18
-
19
-
20
-
21
-
22
-
23
-
24
-
25
-
26
-
27
-
28
-
29
-
30
-
31
-
32
-
33
-
34
-
35
-
 36
36 -
 37
37 -
 38
38 -
 39
39 -
 40
40 -
 41
41 -
 42
42 -
 43
43 -
 44
44 -
 45
45 -
 46
46 -
 47
47 -
 48
48 -
 49
49 -
 50
50 -
 51
51 -
 52
52 -
 53
53 -
 54
54 -
 55
55 -
 56
56 -
57
-
58
-
59
-
60
-
61
-
62
-
63
-
64
-
65
 |
 |

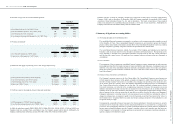
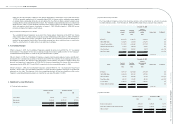
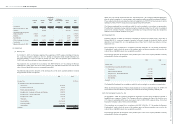
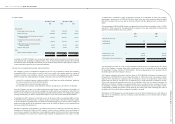
(b) The details of inventories write downs for the years ended December 31, 2008 and 2009 were as follows:
December 31, 2008 December 31, 2009
NT$ NT$ US$
Write-down of inventories to net realizable value 2,417,294 1,080,715 22,896
Net loss on physical inventory 67,278 83,177 2,597
Scrap loss 33,946 45,329 1,415
2,518,518 1,209,221 26,908
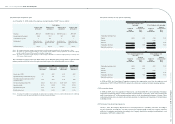
(8) Financial assets carried at cost ‒ noncurrent
December 31, 2008 December 31, 2009
NT$ NT$ US$
Investment in non-publicly listed stock:
Prosperity Venture Capital Corp. 21,000 21,000 656
Sheng-Hua Venture Capital Corp. 20,000 11,900 372
Legend Technology 15,235 11,235 351
W.I. Harper International Corp. 15,050 14,359 448
InCOMM Technologies Co., Ltd. 2,360 2,360 74
IP Fund II 32,400 32,400 1,012
Dragon Investment Co. Ltd. 217,000 217,000 6,775
World Venture, Inc. 262,000 262,000 8,180
iD Reengineering Inc. 174,900 174,900 5,461
DYNA Fund II 23,736 23,166 723
IP Fund III 131,862 128,696 4,018
iD5 Fund LTP 74,751 72,956 2,278
IP Cathay One, L.P. 295,362 258,558 8,072
IP Fund One L.P. 907,431 736,379 22,990
Apacer Technology Inc. 45,340 45,340 1,415
New Century Infocomm Tech Co., Ltd. 341,663 131,340 4,100
Trimode Technology Inc. 12,264 11,038 345
Others 91,916 96,431 3,010
2,684,270 2,251,058 70,280
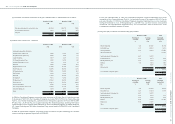
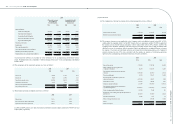
In 2008, the Consolidated Companies increased its equity investments in IP Cathay One, L.P. and other investees
by the amount of NT$97,876. The Consolidated Companies also invested NT$359,759 in New Century Infocomm
Tech Co., Ltd., Trimode Technology Inc., and other investees through the acquisition of E-Ten in 2008. In 2009,
IP Cathay One, L.P., IP Fund One, L.P., Legend Technology, W.I. Harper International, and Sheng-Hwa Venture
capital and other investees returned capital of NT$170,716 to the Consolidated Companies. In 2008, IP Fund One,
L.P., Legend Technology and W.I. Harper International Corp. returned capital of NT$462,552 to the Consolidated
Companies.
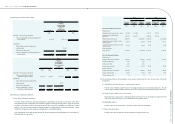
In 2008, the Consolidated Companies sold portions of their investments in Apacer Technology Inc. and other
investees, realizing an aggregate disposal gain of NT$80,462.
For the year ended December 31, 2009, the Consolidated Companies recognized impairment losses on the
investments in New Century Infocomm Tech Co., Ltd. and other investees in the amount of $231,934. For the
year ended December 31, 2008, the Consolidated Companies recognized impairment losses on the investments
in Dragon Investment Co. Ltd., iD Reengineering Inc., and MPC Corp. and other investees in the amount
of $409,141. The aforementioned impairment losses were recorded under “other investment loss” in the
accompanying consolidated statements of income.
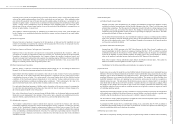
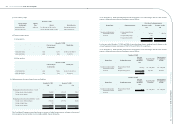
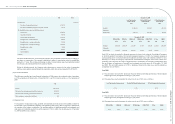
(9) Long-term equity investments accounted for using equity method
December 31, 2008 2008
Percentage of
ownership
Carrying
amount
Investment
income (loss)
% NT$ NT$
Wistron Corporation 4.92 1,814,166 471,792
E-Life Mall Corp. 14.27 442,291 70,763
The Eslite Bookstore 18.62 304,361 (72,508)
Apacer Technology Inc. -
-
(18,962)
Aegis Semiconductor Technology Inc. 44.03 165,235 -
ECOM Software Inc. 33.93 36,771 4,565
Bluechip Infotech Pty Ltd. 33.41 57,361 1,125
FuHu Inc. 9.00 72,518 (987)
Other - 36,087 1,994
Deferred credits - 12,896
2,928,790 470,678
Less: Allocation of corporate expense (66,494)
404,184
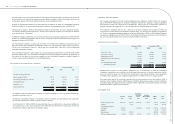
December 31, 2009 2009
Percentage of
ownership
Carrying
amount
Investment
income (loss)
% NT$ NT$
Wistron Corporation 4.40 2,334,164 424,441
E-Life Mall Corp. 14.27 434,174 55,976
Aegis Semiconductor Technology Inc. 44.03 165,235 -
ECOM Software Inc. 33.93 36,310 3,791
Bluechip Infotech Pty Ltd. 33.41 72,303 4,605
FuHu Inc. 25.00 172,982 (26,740)
Olidata S.p.A 29.90 116,579 -
Others -(16,797) 1,737
3,314,950 463,810
Less: Allocation of corporate expense (63,712)
400,098
Acer Incorporated 2009 Annual Report
86.
Acer Incorporated 2009 Annual Report
87. Financial Standing