Acer 2009 Annual Report Download - page 42
Download and view the complete annual report
Please find page 42 of the 2009 Acer annual report below. You can navigate through the pages in the report by either clicking on the pages listed below, or by using the keyword search tool below to find specific information within the annual report.-
 1
1 -
2
-
3
-
4
-
5
-
6
-
7
-
8
-
9
-
10
-
11
-
12
-
13
-
14
-
15
-
16
-
17
-
18
-
19
-
20
-
21
-
22
-
23
-
24
-
25
-
26
-
27
-
28
-
29
-
30
-
31
-
 32
32 -
 33
33 -
 34
34 -
 35
35 -
 36
36 -
 37
37 -
 38
38 -
 39
39 -
 40
40 -
 41
41 -
 42
42 -
 43
43 -
 44
44 -
 45
45 -
 46
46 -
 47
47 -
 48
48 -
 49
49 -
 50
50 -
 51
51 -
 52
52 -
53
-
54
-
55
-
56
-
57
-
58
-
59
-
60
-
61
-
62
-
63
-
64
-
65
 |
 |

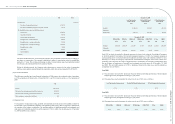
during the year. The Company’s employee stock options and employee stock bonuses to be issued after January
1, 2010 are potential common stock. In computing diluted EPS, net income and the weighted-average number
of common shares outstanding during the year are adjusted for the effects of dilutive potential common stock,
assuming dilutive shares equivalents had been issued. The weighted average outstanding shares are retroactively
adjusted for the effects of stock dividends transferred from retained earnings and capital surplus to common
stock, and employee stock bonuses issued prior to January 1, 2009. Effective January 1, 2009, EPS are not
retroactively adjusted for employee stock bonuses.
(25) Convenience translation into U.S. dollars
The consolidated nancial statements are stated in New Taiwan dollars. Translation of the 2009 New Taiwan
dollar amounts into U.S. dollar amounts, using the spot rate of Bloomberg on December 31, 2009, of NT$32.03
to US$1, is included solely for the convenience of the readers. The convenience translations should not be
construed as representations that the New Taiwan dollar amounts have been, could have been, or could in the
future be, converted into U.S. dollars at this or any other rate of exchange.
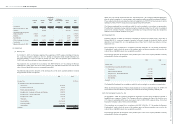
3. Accounting Changes
Effective January 1, 2009, the Consolidated Companies adopted the newly revised SFAS No. 10, “Accounting
for Inventories.” The adoption of this new accounting principle did not have signicant effect on the Company’s
consolidated nancial statements as of and for the year ended December 31, 2009.
Effective January 1, 2008, the Consolidated Companies recognized and measured employee bonuses, and directors’
and supervisors’ remuneration according to Interpretation (2007) 052 issued by the Accounting Research and
Development Foundation. The adoption of this interpretation, which resulted in recognition of employee bonus and
directors’ and supervisors’ remuneration of NT$1,586,563, decreased consolidated net income after tax and basic
earnings per share by NT$1,483,776 and NT$0.59, respectively, for the year ended December 31, 2008.
Effective January 1, 2008, the Consolidated Companies adopted SFAS No. 39, “Accounting for Share-based
Payment,” which requires the Consolidated companies to record share-based payment transactions in the nancial
statements at fair value. The adoption of this new accounting principle did not have significant effect on the
Company’s consolidated nancial statements as of and for the year ended December 31, 2008.
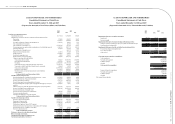
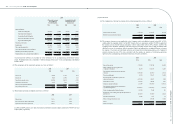
4. Signicant Account Disclosures
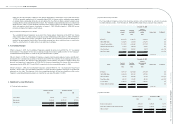
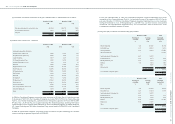
(1) Cash and cash equivalents
December 31, 2008 December 31, 2009
NT$ NT$ US$
Cash on hand 878,683 8,217 257
Bank deposits 13,690,489 34,278,393 1,070,196
Time deposits 7,572,553 19,329,457 603,480
22,141,725 53,616,067 1,673,933
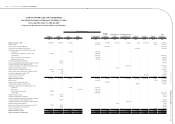
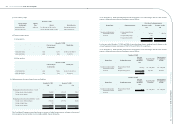
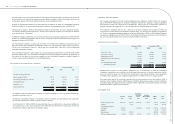
(2) Notes and accounts receivable
The Consolidated Companies entered into factoring contracts with several banks to sell part of accounts
receivable without recourse. As of December 31, 2008 and 2009, details of these contracts were as follows:
December 31, 2008
Buyer
Factored
amount
Factoring
credit limit
Advance
(derecognized)
amount
Interest rate
Collateral
NT$ NT$ NT$
IFITALIA 10,018,176 11,226,373 2,866,914 Nil
ABN AMRO Bank 2,292,296 7,314,804 2,292,296 Nil
Standard Chartered Bank 2,213,795 6,563,600 2,213,795 Nil
Emirates Bank International 415,867 1,082,994 415,867 Nil
China Trust Bank 281,695 1,965,000 190,972 note 7(4)
Taipei Fubon Bank 514,716 1,000,000 514,716 note 7(4)
15,736,545 29,152,771 8,494,560 1.51%~5.9%
December 31, 2009
Buyer
Factored
amount
Factoring
credit limit
Advance
(derecognized)
amount
Interest rate
Collateral
NT$ NT$ NT$
IFITALIA 6,877,785 11,219,842 2,091,300 Nil
ABN AMRO Bank 3,480,028 7,881,189 3,227,242 Nil
China Trust Bank 218,706 1,750,000 218,706 note 7(4)
Taipei Fubon Bank 442,145 968,500 442,145 note 7(4)
La Caixa Bank 3,200,041 3,724,657 3,200,041 Nil
Emirates Bank International - 960,900 - Nil
14,218,705 26,505,088 9,179,434 0.83%~5%
(3) Other receivable
December 31, 2008 December 31, 2009
NT$ NT$ US$
Income tax and sales tax 2,001,212 1,690,263 52,771
Receivables of patent royalty allocated to others 2,061,655 1,164,992 36,372
Other receivable 4,744,587 6,407,897 200,059
8,807,454 9,263,152 289,202
Acer Incorporated 2009 Annual Report
78.
Acer Incorporated 2009 Annual Report
79. Financial Standing